The content of research paper

Comparison of metabolic parameters between oral and total parenteral nutrition in children with severe eating disorders

Yuichi Suzuki, Shuntaro Itagaki, Maki Nodera, Kazuhide Suyama, Hirooki Yabe, Mitsuaki Hosoya

Author information
  • Yuichi Suzuki

    Department of Pediatrics, Fukushima Medical University School of Medicine

  • Shuntaro Itagaki

    Department of Neuropsychiatry, Fukushima Medical University School of Medicine

  • Maki Nodera

    Department of Pediatrics, Fukushima Medical University School of Medicine

  • Kazuhide Suyama

    Department of Pediatrics, Fukushima Medical University School of Medicine

  • Hirooki Yabe

    Department of Neuropsychiatry, Fukushima Medical University School of Medicine

  • Mitsuaki Hosoya

    Department of Pediatrics, Fukushima Medical University School of Medicine

Introduction

Eating disorder treatment requires a multifaceted approach, encompassing bio-psycho-social support. However, no single approach has been shown to be clearly superior; thus, a combination of refeeding with anorexia nervosa-specific psychotherapy may be most effective1). As chronic undernutrition results in reduced basal metabolism and heightened catabolism for energy production, one important goal of this care is recovery from malnutrition, primarily achieved through various refeeding methods, such as enteral nutrition via oral intake, tube feeding, and intravenous therapy. However, a rapid glucose influx during refeeding increases the intracellular demand for key minerals, leading to metabolic fluctuations2). This response elevates the risk of refeeding syndrome due to energy supply-demand imbalances that may manifest after one or two weeks from the start of refeeding. In addition, another concern has been suggested in some case reports regarding severe repercussions in gravely malnourished patients (BMI of 9-12 kg/m2), such as intractable hypoglycemia and fatal cardiac complications, after starting refeeding3,4). Notably, complications like refeeding syndrome can arise irrespective of refeeding approach5-7). Refeeding syndrome can result in organ dysfunction due to abnormal electrolyte levels and water imbalances8). Established guidelines, such as those of the UK’s National Institute for Health and Care Excellence (NICE), have identified extreme leanness and prolonged undernutrition as key risk factors for refeeding syndrome2). Recommended preventive measures include an initial energy dose reduction to 5-20 kcal/kg/day for those with an extremely low BMI (< 14 kg/m2)9), as well as supplements of thiamine, potassium, phosphate, calcium, and magnesium before and during the first 10 days of refeeding, unless their blood levels are high the reference range10,11).


However, the most effective and safe treatment for weight restoration in children and adolescents with eating disorders remains controversial12). Although there are few previous studies that compared short-term outcomes of oral intake and intravenous therapy for eating disorder patients13), a standardized and safe refeeding protocol for eating disorders has not yet been achieved due to insufficient evidence in support of changing the current standard refeeding approach14). A further challenge is to decide when to administer lipid preparations for patients receiving intravenous therapy such as fat-free total parenteral nutrition (TPN) due to inability of oral intake. A lipid preparation supplies high energy, but for severely lean patients, it is recommended to initiate refeeding with low energy loads because high energy loads are thought to increase the risk of refeeding syndrome in these patients. In short, not much is known with respect to the right amount and composition of energy doses and the right timing to initiate refeeding therapy, especially for severely lean patients. Consequently, clarity is lacking with regard to the right energy dose as well as the composition and timing of refeeding15). When it comes to lipid-based energy, the high energy load in intravenous therapy makes initiating treatment with fat preparations challenging in severely lean patients. Currently, there are no defined metrics to guide the timing and dosage of fat preparations during the refeeding process.


We hypothesized that the metabolism of eating disorder patients is primarily dependent on glucose immediately after the start of refeeding therapy, resulting in persistently elevated lipid levels. Given that, in a state of chronic undernutrition, the body predominantly relies on lipids for energy, a rapid shift to glucose dependence during refeeding can lead to potential energy imbalances such as lipid metabolism abnormalities16). The data found in a previous systematic review and meta-analysis clearly showed elevated lipid and lipoprotein concentrations in individuals with anorexia nervosa (AN) compared with healthy controls, and persistence of elevated lipid concentrations in AN after partial weight restoration17), thus supporting our hypothesis.


The aims of the present study were to elucidate the variations in lipid metabolism as per refeeding strategies, determine the fluctuations in lipid demand during metabolic transition from pre- to post-refeeding states, and discern the optimal timing for lipid preparation administration.

Materials and Methods

Selection Criteria


The present study included a total of 18 patients with eating disorders who were admitted to the pediatric ward or the neuropsychiatry ward of our hospital. These patients were diagnosed with eating disorders based on the Diagnostic and Statistical Manual of Mental Disorders, Fifth Edition (DSM-5) criteria18).


The patients were categorized into the following DSM-5 classifications: anorexia nervosa restricting type, anorexia nervosa binge-eating/purging type, and avoidance/restricted food intake disorder.


Anorexia nervosa is characterized by: weight loss or lack of weight gain in growing children; difficulties maintaining an appropriate body weight for height, age, and stature; and, in many individuals, a distorted body image. Anorexia nervosa restricting type (AN-R) is defined by weight loss primarily through dieting, fasting, and/or excessive exercise without recurrent episodes of binge eating or purging in the previous three months, resulting in significantly low body weight. Anorexia nervosa binge-eating/purging type (AN-BP) includes individuals with recurrent episodes of binge eating or purging behaviors (self-induced vomiting or misuse of laxatives, diuretics, or enemas) at least once a week for the last three months, in addition to significantly low body weight. Avoidant/restrictive food intake disorder (ARFID) is characterized by: an apparent lack of interest in eating or food; avoidance of foods based on their sensory characteristics; or concern about aversive consequences of eating.


Study Duration


The study was carried out over a five-year period, from April 2014 to March 2019. We observed physical conditions in patients with eating disorders who received nutrition therapy for the first month after admission to hospital.


Medication Management


Patients who had taken medications that can affect carnitine metabolism, specifically sodium valproate or pivoxil, within one month prior to admission were excluded from the study.


Lifestyle Guidance


The physical conditions of the patients were assessed via daily physical examinations and weekly body weight measurements before breakfast. Blood cell and blood chemistry panels were conducted at the time of admission and again at 2 and 4 weeks, also prior to breakfast. The tests included complete blood count, liver and kidney functions, creatine kinase, electrolytes (potassium, magnesium, phosphate), blood glucose, albumin, and lipids (triglycerides, total cholesterol).


Types of Nutritional Therapy and Allocation of Patients


The refeeding method for each patient was chosen from either oral diet (OD) or total parenteral nutrition (TPN) by the physicians based on the risks and preferences of the patient and their family after comprehensive consideration of various factors, including whether the patient was capable of oral intake and whether they were hospitalized in the pediatric ward or the neuropsychiatry ward. For OD, either hospital diets or oral nutritional supplements such as ENEVO® or ENSURE LIQUID® were used. TPN was administered via infusion, which could include glucose-added acetate maintenance solution, amino acid solution, or high-calorie infusion. The energy dose at initiation of treatment, as well as its rate of increase, were determined by the attending physician. This study included a retrospective observation of previously conducted treatments, rather than interventions.


Each blood sample was centrifuged immediately after collection and stored at −80°C for further serum carnitine analysis. A general blood test was conducted three times, as described above. However, additional tests were performed at the physician’s discretion. If refeeding syndrome developed, a blood sample was collected at the time of onset, and after subsequent analyses were completed, the necessary treatment was provided to the patient accordingly.


The carnitine level was measured by performing the differential blood carnitine test using the enzyme cycling method19). The total carnitine level was measured using T-Carnitine reagent Kainos (KAINOS Laboratories, Inc., Tokyo, Japan), and the free carnitine (FC) level using F-Carnitine reagent Kainos (KAINOS Laboratories, Inc., Tokyo, Japan). The value obtained by subtracting the FC level from the total carnitine level was referred to as acylcarnitine (AC).


The Statistical Package for the Social Sciences software version 26 (IBM Inc., New York, USA) was used for all analyses. Normality was assessed using the Shapiro-Wilk test. If normality was observed, the independent t-test for single measures was performed between the two treatment groups. If there was no normality, the Wilcoxon signed-rank test was conducted. A two-way analysis of variance was performed to determine the presence or absence of time-lapse interaction between the two groups. A p value of < 0.05 was considered statistically significant.

Results

Background characteristics and biochemical parameters of patients


As shown in Table 1, refeeding methods were divided between oral nutrition (12 patients) and total enteral nutrition (6 patients). Patients who experienced a recurrence all selected OD, while younger children tended to select TPN, typically due to a refusal of oral intake or a fear of swallowing. The disease classifications, according to the Diagnostic and Statistical Manual of Mental Disorders (DSM-5), included AN-R (12 patients), AN-BP (3 patients), and ARFID (3 patients). The mean ages of the participants were 17.3 (range: 12-24) years in the OD group and 12.6 (range: 11-13) years in the TPN group. The OD group included patients with recurrence. The mean ages and heights at admission were significantly higher in the OD group than in the TPN group (p < 0.01 and p = 0.03, respectively). However, there was no significant difference in SD score (p = 0.35). The mean BMIs at admission were 12.8 (range: 11.1-15.6) kg/m2 in the OD group and 12.7 (range: 11.2-15.2) kg/m2 in the TPN group. When compared by SD score, the mean BMI-SDS was −5.20 (range:−8.70-−2.66) in the OD group, and that in the TPN group was −3.54 (range:−5.66-−2.34). However, there was no significant difference in body weight between the two groups. Moreover, there was no significant difference regarding duration from anorexia nervosa onset to admission and the rate of weight loss.


All the patients’ blood test results for blood count, electrolytes, and liver transaminase were within reference intervals at admission. The OD group had significantly lower serum p levels than the TPN group. However, none of the patients presented with serum p levels below the reference range. In both groups, total cholesterol (TC) and triglyceride (TG) levels at admission were within or above their respective reference ranges. FC level at admission did not significantly differ between the groups. In all patients, the free triiodothyronine (T3) value, which indicates malnutrition, was below the reference range. However, there were no significant differences between the two groups.


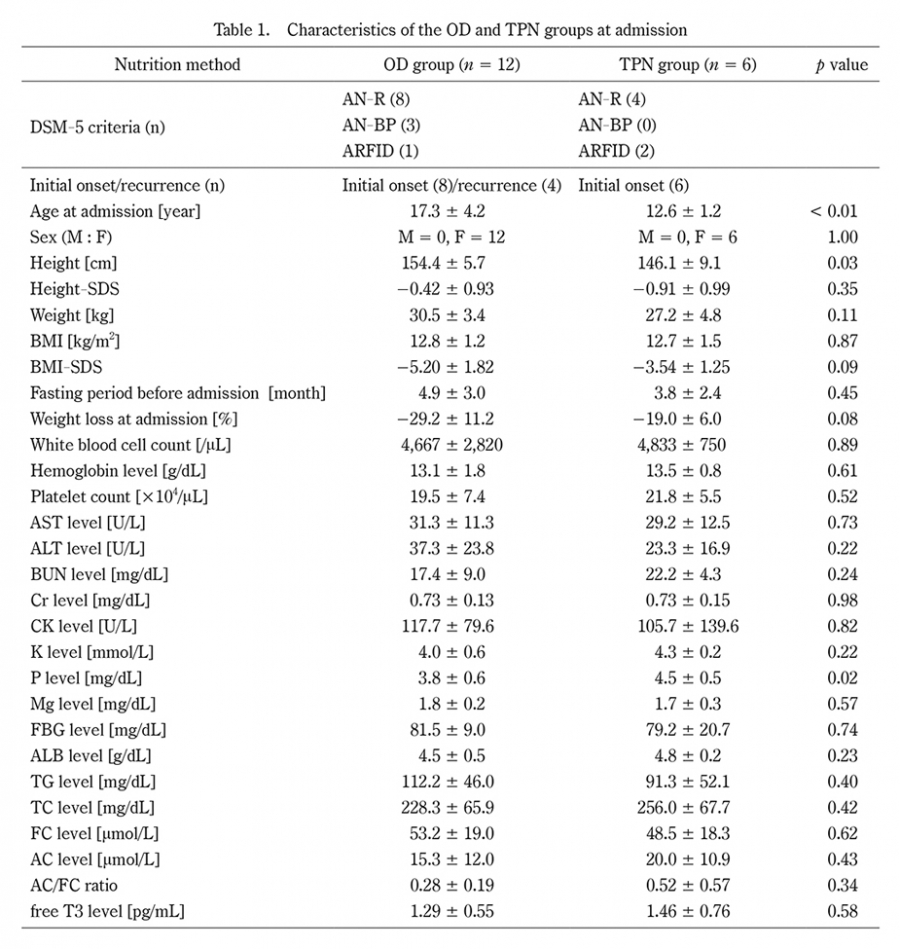
Table 1. Characteristics of the OD and TPN groups at admission

OD: oral diet, TPN: total parenteral nutrition, AN-R: anorexia nervosa restricting type, AN-BP: anorexia nervosa binge-eating/purging type, ARFID: avoidant/restrictive food intake disorder, BMI: body mass index, M ± SD: mean ± standard deviation, FBG: fasting blood glucose, TG: triglyceride, TC: total cholesterol, FC: free carnitine, AC: acylcarnitine, free T3: free triiodothyronine,

Data were expressed as M ± SD, with p < 0.05 indicative of a significant difference between the OD and TPN groups.


Metabolic parameters before and after the start of refeeding


Figure 1 shows the number of patients in the OD group and the TPN group one month after refeeding. Patients who developed refeeding syndrome were excluded. As shown in Table 2, the total energy dose per body weight was significantly higher in the OD group (n = 11) than in the TPN group (n = 5) at the start of refeeding (32.1 kcal/kg vs 8.8 kcal/kg) and 1 week after admission (36.3 kcal/kg vs 19.8 kcal/kg), but no significant difference was shown at 2 weeks (45.6 kcal/kg vs 35.5 kcal/kg) or at 4 weeks (51.0 kcal/kg vs 46.6 kcal/kg). Figure 2 shows changes in the total energy dose and the individual doses of each of the three nutrients (Fig. 2a), as well as and variations in heart rate and BMI (Fig. 2b), over a 1-month period after starting refeeding. The TPN group had significantly lower values for total energy dose, glucose, and protein than the OD group, both at admission and at 1 week after the start of refeeding. The values for total energy dose, glucose, and protein at 2 weeks did not show a significant difference (45.6 vs 35.5 kcal/kg, p = 0.08, 5.8 vs 6.3 kcal/kg, p = 0.60, and 2.2 vs 2.6 kcal/kg, p = 0.19). However, the glucose dose at 4 weeks was significantly higher in the TPN group than in the OD group (7.2 vs 9.9 kcal/kg, p = 0.03). The lipid dose at 4 weeks was significantly higher in the OD group than in the TPN group (1.4 vs 0.7 kcal/kg, p < 0.001), although the latter started receiving lipid preparations after 2 weeks of hospitalization. BMI-SDS did not significantly differ between the two groups during the entire refeeding process, although HR was significantly higher in the TPN group than the OD group at 4 weeks (61.2 vs 73.4, p = 0.02) (Fig. 2b).


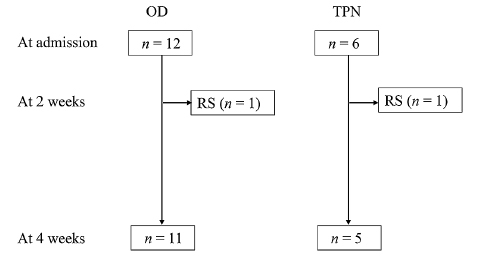
Fig. 1. Flowchart of patient enrollment and division into two nutrition methods

One patient in each group developed refeeding syndrome at day 11 of hospitalization; they were excluded from the evaluation. Neither presented with laboratory findings indicative of lipid metabolism. Nevertheless, the condition of these patients improved with intensive care.


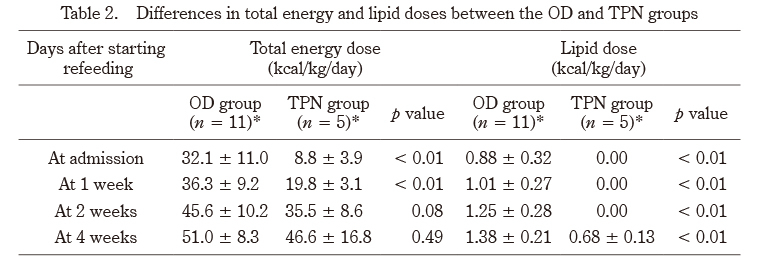
Table 2. Differences in total energy and lipid doses between the OD and TPN groups

OD: oral diet, TPN: total parenteral nutrition *Patients with refeeding syndrome were excluded.


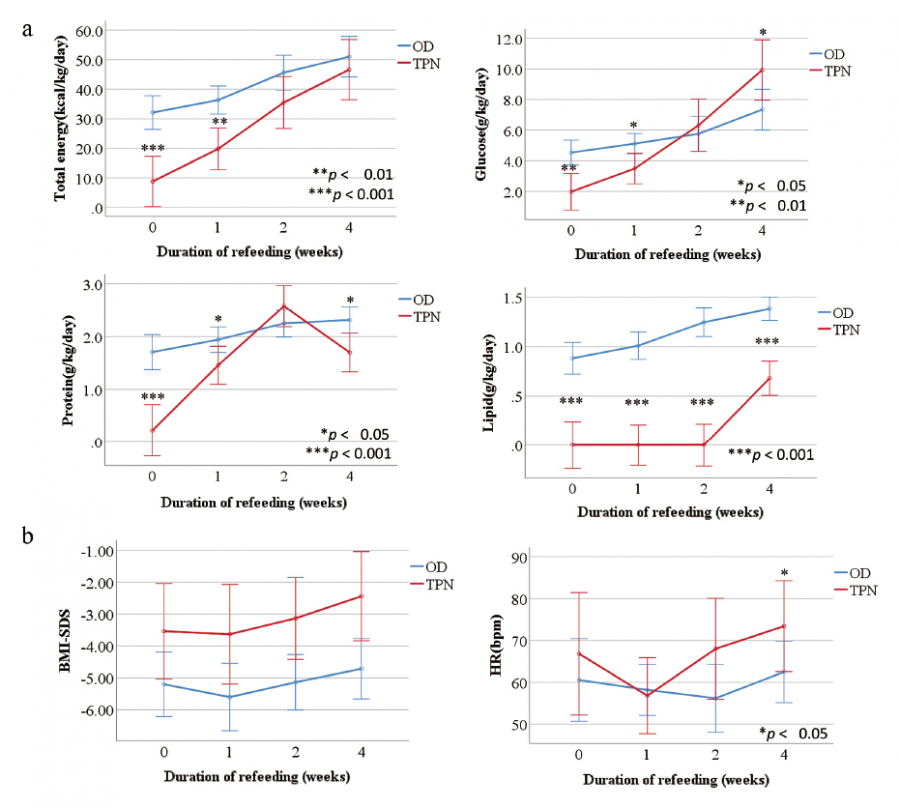
Fig. 2. Changes in the total energy dose, doses of three major nutrients, BMI, and HR

a. Changes in the total energy dose and doses of glucose, protein, and lipid. Patients in the TPN group initially had lower energy and glucose/protein doses than those in the OD group, but their glucose level sharply increased from week 2 to week 4 while that of the OD group patients showed a gradual and constant increase. This is likely associated with the initiation of lipid administration to the TPN group at 2 weeks from admission.

b. Changes in body mass index and heart rate over 4 weeks. Except for the HR at 1 week, there was no significant difference between the two groups.

BMI, body mass index;HR, heart rate;bpm, beats per minute.

Values are presented as mean ± SD for oral diet (n = 11) and total parenteral nutrition (n = 5). Significance values:*p < 0.05, **p < 0.01, ***p < 0.001. OD, oral diet;TPN, total parenteral nutrition.


Blood biochemical factors at 2 weeks after the start of refeeding


Table 3 shows the general blood analysis results of the OD and TPN groups. The OD group had a significantly lower serum P level than the TPN group. However, none of the OD group patients presented with serum P levels below the reference range (2.5-4.5 mg/dL). The fasting blood glucose (FBG) and serum albumin (ALB) levels did not significantly differ between the OD and TPN groups. Nevertheless, the TPN group had significantly lower TG (92.3 vs 32.6 mg/dL, p < 0.01), TC level (214.9 vs 133 mg/dL, p < 0.01), and AC/FC ratio (0.18 vs 0.10, p = 0.04) than the OD group. Moreover, the FC and AC levels did not differ between the two groups. However, the values decreased in both groups from the pre-refeeding levels


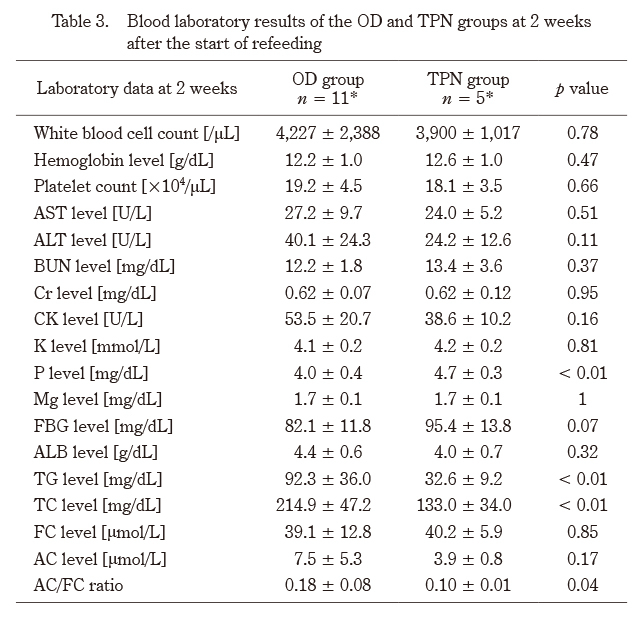
Table 3. Blood laboratory results of the OD and TPN groups at 2 weeks after the start of refeeding

OD: oral diet, TPN: total parenteral nutrition, M ± SD: mean ± standard deviation, FBG: fasting blood glucose, TG: triglyceride, TC: total cholesterol, FC: free carnitine, AC: acylcarnitine, free T3: free triiodothyronine

Data were expressed as M ± SD, with p < 0.05 indicative of a significant difference between the OD and TPN groups, excluding patients with refeeding syndrome. *Patients with refeeding syndrome were excluded.


Changes in lipid levels during the refeeding period


Figure 3 shows the changes in lipid levels over the refeeding process. At 2 weeks from the refeeding onset, the TPN group had significantly lower TC and TG levels than the OD group, although no significant differences were observed at 4 weeks. As for the FC level, two patients in the OD group and one in the TPN group had higher levels than reference range (36-74 µg/mL) at admission, which decreased to the reference range after refeeding started. On the other hand, three OD patients and one TPN group patient had lower FC levels than the reference range at admission, but after the start of refeeding, their values exceeded the reference range except one OD patient. The AC/FC ratio at admission was higher than the reference value (< 0.25) in five patients each in the OD group and TPN group. The AC/FC ratio of > 0.4, indicating carnitine deficiency, was observed in two patients in the OD group and one in the TPN group. At 2 and 4 weeks after the start of refeeding, the AC/FC ratio of both groups decreased from pre-treatment levels, and all patients had an AC/FC of < 0.4. In addition, the AC/FC ratio of the TPN group was significantly lower than that of the OD group (0.18 vs 0.10, p = 0.04 at 2 weeks; 0.15 vs 0.11, p < 0.01 at 4 weeks) (Fig. 3).


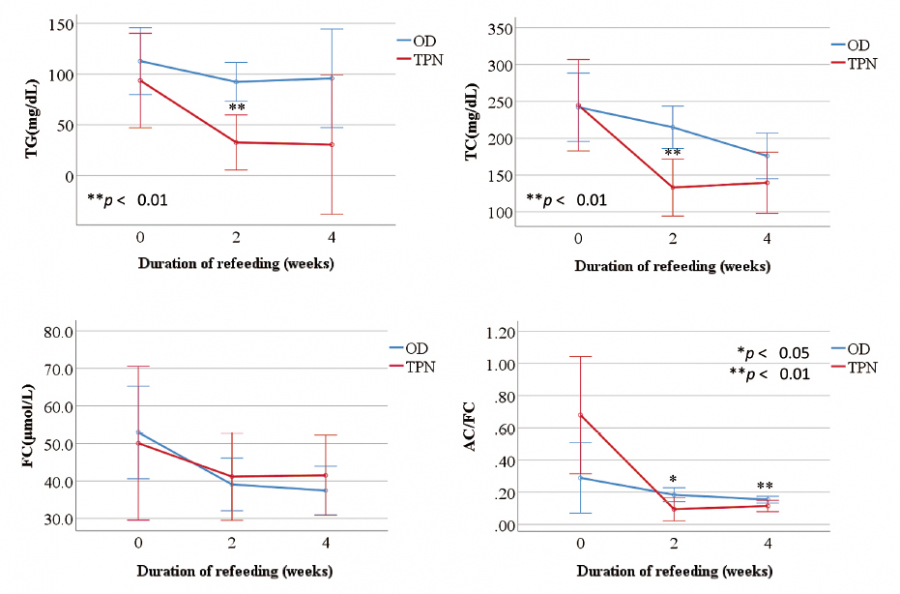
Fig. 3. Changes in lipid metabolism during refeeding

After two weeks of refeeding, the TPN group showed notably lower TC and TG levels compared to the OD group, although these differences were not significant at 4 weeks, as they had been at admission. The AC/FC ratio, an indicator of the carnitine level, was above the reference range in several patients on admission. However, after refeeding, all patients had an AC/FC of < 0.4.

The reference ranges in our hospital are TG 50-149 mg/dL, TC 150-199 mg/dL, FC 36-74 µg/mL, and AC/FC 0.25-0.4. TG, triglyceride; TC, total cholesterol; FC, free carnitine; AC, acyl carnitine; AC/FC, FC-to-AC ratio.

Discussion

During the one-month refeeding period with either OD or TPN, there were clear differences in metabolic parameters between the two groups. The OD group had a higher total energy dose both at the start of refeeding and one week after, but there was no difference after two weeks. The glucose dose was higher in the TPN group after four weeks. Regarding blood biochemical factors at 2 weeks, the TPN group had significantly lower levels of TG and TC compared to the OD group. However, there were no significant differences in other factors, such as fasting blood glucose and serum albumin levels. The AC/FC ratio decreased in both groups after the start of refeeding, and it was significantly lower in the TPN group compared to the OD group.


It should be noted that the two groups differed in total energy and lipid doses at the beginning of refeeding because the TPN solutions did not contain lipid. This is the reason for the higher glucose and lower lipid energy load in the TPN group. In the neuropsychiatry ward, high-energy meals were provided for oral intake. In contrast, in the pediatric ward, provision of energy content was initiated with a small amount because the TPN solution contained the required energy load. Therefore, the TPN group patients, who were incapable of enteral nutrition, were disadvantaged in terms of high-energy lipid emulsion loading.


Recent studies have reported a risk of low-energy syndrome, a state of undernutrition/underfeeding due to starting a nutrition therapy with a low energy dose and later increasing it, which may lead to a loss of body weight despite increased energy intake15). Other studies have reported that the treatment is safe, and it does not increase the risk of complications even if a high energy dose is administered at an early stage21-23). According to previous studies on physical management during refeeding2,9,24,25), the recommended total energy dose varies from 5 to 40 kcal/kg. The NICE guidelines recommend that the risk criteria for refeeding syndrome include one or more of the following: a BMI of < 16 kg/m2; weight loss of 15% or more within the previous 3-6 months; limited nutrition for 10 days or more; and low levels of potassium, phosphate, and magnesium before the start of nutrition therapy2). The participants of the present study were at high risk for refeeding syndrome. There is accumulating evidence showing that high-energy diet at the early stage of refeeding is safe for patients who are not severely lean15,21). However, there are only a few studies that have assessed the safety of a high-energy diet in individuals with severe eating disorders, or have investigated appropriate proportions of major nutrients for such individuals. That is to say, uncertainty still remains regarding the optimal refeeding approach for severe eating disorders. Some studies have addressed the importance of carbohydrates in diet to prevent refeeding syndrome, and have suggested 58.4% as the cutoff value for the proportion of carbohydrates26). Another study reported that no significance difference was observed between patients on diets with carbohydrate contents of < 40% and 50-60%27), suggesting, again, the importance of carbohydrates in the management of refeeding syndrome risks.


Several studies have reported a relationship between refeeding and lipid metabolism. In humans, short-term fasting/refeeding increases lipid metabolism 50-fold and 6-10-fold from the fasting levels through the transcription of pyruvate dehydrogenase kinase 4 and lipoprotein lipase, respectively. Furthermore, short-term fasting/refeeding has been reported to affect the transcription of some genes in the skeletal muscle correlated with lipid metabolism28). These changes likely suppress glucose metabolism and lead to the shift to lipid metabolism. A previous study reported that infants showed low carnitine levels after 7-10 days of parenteral nutrition without carnitine supplementation29). In mouse experiments, no differences in TG levels in the liver were observed among non-fasting, fasting, and fasting/refeeding groups30). However, repeated fasting/refeeding significantly reduced serum TG, carnitine, and acylcarnitine concentrations in the fasting/refeeding group. This means that re-supplementation with glucose and proteins after fasting increased the energy storage capacity of the liver, which promoted fatty acid metabolism and decreased serum TG levels21,23). These studies’ findings on humans and mice suggest that fasting reduces the liver’s ability to synthesize TG. However, refeeding activates the carnitine transport system in the liver and promotes fatty acid metabolism. The results of the present study showed that supplementation with low-energy dose without lipids decreased serum TG concentrations in the TPN group (Fig. 3). These results can be explained by the same mechanism as that shown in the abovementioned studies, suggesting the TPN group had a higher lipid storage capacity in the liver after 1-2 weeks of refeeding.


The TPN group began their lipid intake 2 weeks after starting refeeding, and the average days from admission to the start of lipid administration was 21.8 days. The lipid metabolism of this group was enhanced, and the TG and TC levels were decreased significantly by the second week of refeeding. This suggests that the refeeding regimen starting with a low energy load and not using high-energy lipids from the beginning was not physiologically relevant for the patients on TPN therapy. A report has recommended that the proportion of energy from major nutrients for refeeding of eating disorder patients be fat 25-35%, protein 15-20%, and glucose 50-60%26). Some other reports have suggested different compositions, but there is no established consensus. However, the findings of the present study underscore the importance of considering not only the total energy dose but also the energy composition of major nutrients, especially lipids, in refeeding therapy for eating disorders even when patients are on total parenteral nutrition.

Study limitations

There are several limitations to the present study. The subjects of this study were recruited from a small number of institutions and were not randomized, which may have led to selection bias. The sample size was relatively small, which limits the generalizability of the results. Although the OD group and the TPN group did not have significant weight differences at admission, the inclusion of relapse cases in the OD group led to a significantly higher average age compared to the TPN group, raising the possibility of inherent differences between the two groups. Although it was suggested that even patients on TPN, which contains no lipids, require lipids as an energy source, it remains unclear whether the intravenous administration of lipids can prevent refeeding syndrome. Furthermore, the present study was prospective in design, and the outcomes obtained were not based on predetermined items, which might have affected the consistency of data collection. Therefore, the results of the present study may not be applicable to larger or more diverse populations, or to different treatment settings.

Conclusion

This study investigated changes of lipid parameters in children with severe eating disorders during refeeding in order to explore the optimal timing for lipid preparation administration. At 2 weeks after the start of refeeding, TC, TG, and AC/FC levels were significantly lower in the TPN group than in the OD group. Fat-free glucose-based nutrition promoted lipid metabolism, suggesting that balanced energy and lipid intake are essential, even in TPN.

Acknowledgements

We want to thank Dr. Itaru Miura, Dr. Yusuke Osakabe, Dr. Syo Horikoshi, Dr. Haruka Ochiai, Dr. Akiko Sato, Dr. Masashi Ito, Dr. Atsuko Nagaoka, Dr. Tomohiro Wada, Dr. Junya Matsumoto, Dr. Sinnosuke Yamamoto, and Dr. Taishi Asano of Department of Neuropsychiatry, Fukushima Medical University, as well as Dr. Atsushi Ono, Dr. Ryo Maeda, and Dr. Yuichiro Asano of Department of Pediatrics, Fukushima Medical University, for providing patient data.

Conflict of Interest Disclosure

All authors declare no personal conflicts of interest. The Department of Pediatrics, Fukushima Medical University, has received research funding from Otsuka Pharmaceutical Co., which was used for carnitine measurement.

Authorship Contribution

As the lead author, Yuichi Suzuki contributed to conception and design of this work, data collection, data analysis and interpretation, and preparation of this manuscript.


Shuntaro Itagaki, Maki Nodera, and Kazuhide Suyama were involved in data collection, data analysis and interpretation, as well as critical proofreading of important intellectual content, and provided the final approval of the manuscript. Hirooki Yabe and Mitsuaki Hosoya were responsible for the overall management of this study and contributed to its conception and design, as well as data analysis and interpretation, and critical review of important intellectual content. All authors have agreed on the final version of the submitted manuscript.

Declarations

Ethical approval and consent to participate: This study was approved by the Research Ethics Committee of Fukushima Medical University School of Medicine (No. 2018).


Consent for publication: Not applicable


Availability of data and materials: Not applicable


Acknowledgments: We would like to thank all the children and their families who participated in this study.