Data sources and search strategy
The literature search consisted of a thorough search of PubMed and the Cochrane Central Register of Controlled Trials (CENTRAL), with further hand searches. The following terms were used in the literature search:renal dialysis, and fear of falling.
Prevalence and enhancing factors of FOF in the general elderly population
The prevalence of FOF may increase with the experience of falls and fractures. The proportion of older adults with FOF is estimated to be 20% to 39% overall30) and 40% to 73% in those with a history of falls31). Additionally, the prevalence of FOF after proximal femoral fractures ranged from 22.5% to 100%, with a tendency to decrease over time32).
On the other hand, the increase in FOF is associated not only with a history of falls but also with factors. Chang et al. conducted a large-scale cross-sectional study involving 3,824 individuals to investigate the factors associated with FOF among community-dwelling older people. The results showed that the following were significantly associated with falls in the past year (odds ratio [OR] = 2.23, 95% confidence interval [95% CI] = 1.80–2.76):age ≥ 75 years (OR:1.52, 95% CI:1.32–1.75); female gender (OR:1.78, 95% CI:1.55–2.05); needing assistance from relatives to access medical facilities (vs. self-help, OR:1.32, 95% CI:1.14–1.62); needing assistance from public resources to access medical facilities (vs. self-help, OR:1.28, 95% CI:1.03–1.58); diabetes (OR:1.32, 95% CI:1.09–1.62); cardiovascular disease (OR:1.19, 95% CI:1.00–1.41); history of stroke (OR:1.94, 95% CI:1.02–1.59); insomnia (OR:1.50, 95% CI:1.26–1.80); a Geriatric Depression Scale (GDS) score of ≥ 5 (vs. GDS score < 5, OR:1.78, 95% CI:1.34–2.33); good and fair subjective health status (vs. excellent and very good subjective health status, OR:1.35, 95% CI:1.13–1.62); and poor subjective health status (vs. excellent and very good subjective health status, OR:2.52, 95% CI:1.75–3.64). SF-36 score, which evaluates QOL, was significantly lower in the individuals with FOF than in those without FOF in both sexes (p < 0.01)33). Regarding the association between FOF and dementia, Uemura et al. conducted a prospective cohort study of 1,700 community-dwelling individuals aged ≥ 65 years without FOF at baseline. At 15-month follow-up, 452 individuals (26.5%) reported the onset of FOF. In addition, mild dementia (OR:1.41, 95%CI:1.07–1.87) and falls (OR:3.00, 95%CI:2.23–4.07) during the follow-up period were identified as independent predictors of the onset of FOF. Furthermore, the incidence of FOF was higher in individuals with both mild dementia and a history of falls compared to those without these factors (OR:7.34 95%CI:4.06–13.3)34). Regarding visual impairment, Ehrlich et al. conducted a questionnaire survey of 36,229 elderly people in the United States, and reported that those with visual impairment had a higher OR for FOF compared to those without (OR:1.69, 95% CI:1.53–1.88, p < 0.001)35). Additionally, in a systematic review investigating the association between frailty and FOF, the adjusted ORs in longitudinal studies ranged from 1.18 (95% CI:1.02–1.36) to 9.87 (95% CI:5.22–18.68), while the adjusted ORs in cross-sectional studies ranged from 1.04 (95% CI:1.02–1.07) to 7.16 (95% CI:2.34–21.89)36). Regarding depression, Choi et al. found in their longitudinal study of 6,299 older adults that those with FOF had significantly higher odds of depression compared to those without FOF (OR:2.64, 95% CI:1.98–3.51) 37).
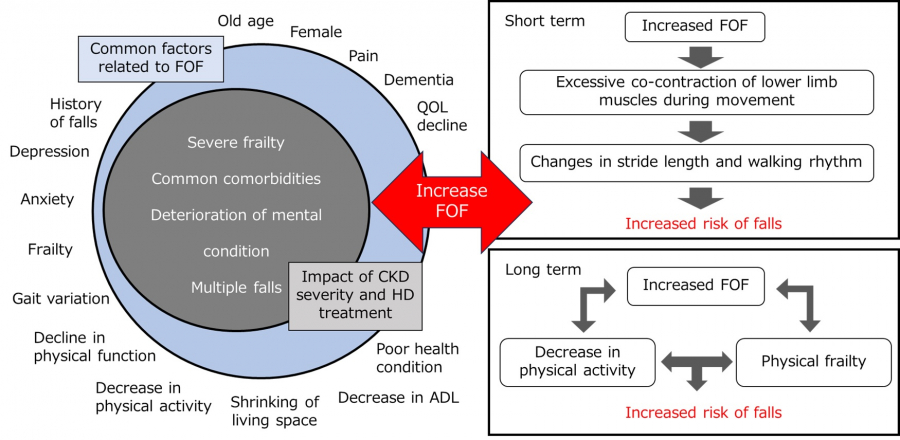
Donoghue et al. reported an association between FOF and gait variability in a cross-sectional study of 1,307 community-dwelling elderly people. Compared to a group without FOF, a group with FOF and no activity limitations showed decreases in gait speed (β –4.18, p < 0.01) and stride length (β–3.41, p < 0.01), as well as increases in step width (β 0.55, p < 0.01) and double support phase (β 1.10, p < 0.01). In addition, even in the group with FOF but no activity limitations, decreases in walking speed (β–7.30, p < 0.001) and stride length (β–5.69, p < 0.001), as well as increases in step width (β 0.71, p < 0.05) and double support phase (β 1.15, p < 0.05) were observed38). Regarding physical activity, Jefferis et al. conducted a cross-sectional study involving 1,680 elderly men living in the community. The study revealed that men with FOF, compared to those without, took 1,766 fewer steps per day (95% CI:1391–2142), and spent 27 minutes less in light physical activity (95% CI:18–36), 18 minutes less in moderate to vigorous physical activity (95% CI:13–22), and 45 minutes more in sedentary behavior (95% CI:34–56)39). Regarding living space, Auais et al. reported a significant association between FOF and spatial mobility in a cross-sectional study involving 1,841 community-dwelling older adults (aged 65–74 years) (B:–0.15, 95%CI:–0.26 to –0.04, p < 0.001)40). Regarding anxiety and ADL limitations, Bahat Öztürk et al.’s cross-sectional study of 1,021 community-dwelling elderly people revealed associations between FOF and anxiety (OR:2.8, 95% CI:1.2–6.8, p = 0.02), as well as ADL limitations (OR:2.6, 95% CI:1.06–6.4, p = 0.04) 41). Regarding physical function and pain, Tomita et al. conducted a cross-sectional study of 278 community-dwelling Japanese women aged ≥ 65 years. As a result, FOF was significantly associated with the following physical function measurements:increased 6-m walking time (OR:1.99, 95%CI:1.35–2.91), increased time to stand up from a chair (OR:2.11, 95%CI:1.42–3.15), decreased grip strength (OR:1.38, 95%CI:1.01–1.87), and increased Timed Up and Go test (TUG) (OR:2.62, 95%CI:1.76–3.90). In terms of pain, low back pain (OR:2.12, 95%CI:1.16–3.87), upper limb pain (OR:1.93, 95%CI:1.04–3.57), and lower limb pain (OR:2.06, 95%CI:1.223.49) were significantly associated with FOF42). The studies reporting factors related to FOF mentioned above include cross-sectional results, and large-scale longitudinal studies are needed to demonstrate a causal relationship with FOF.
FOF evaluation tool
The most commonly used FOF assessment tool is the Falls Efficacy Scale-International (FES-I)43). The FES-I is a scale used for quantitatively evaluating self-efficacy regarding falls and has been confirmed to have good validity and reliability. It was developed through joint research in Europe, with international use in mind. The FES-I consists of 16 items asking about concerns regarding falls in daily life, and each item is rated on a scale of 1–4 points:1 = not concerned at all; 2 = somewhat concerned; 3 = quite concerned; and 4 = very concerned. Total scores range from 16 to 64 points, with higher scores indicating lower self-efficacy for falls. Additionally, previous research has shown that the FES-I total score can be categorized into two groups for fall concerns:mild (16–22 points) and severe (23–64 points). It can also be classified into three groups:mild (16–19 points), moderate (20–27 points), and severe (28–64 points)44). The FES-I has been confirmed to have good validity and reliability45).
Another commonly used assessment tool was the Modified Falls Efficacy Scale (MFES), which consists of 14 items on activities of daily living and applied activities of daily living related to falls. Each item is scored on a numerical rating scale from 0 to 10, with 0 indicating not confident, and 10 indicating completely confident. In other words, the lower the score, the stronger the FOF46). The overall score is calculated as the average of the scores for each of the 14 questions.
The FES-I and MFES are both questionnaire-based assessment tools available in Japanese, consisting of items related to fall-associated ADLs and Instrumental Activities of Daily Living. The main difference is that each item is scored from 0 to 4 points in the FES-I, but 0 to 10 points in the MEFS. Therefore, the FES-I can be used to roughly evaluate FOF, while the MFES may be more appropriate for a more detailed evaluation. However, there are no papers showing the translation process of either evaluation method into Japanese, and no published reports verifying their reliability, which is a cause for concern.
Research report on FOF in patients undergoing HD (Table 1)
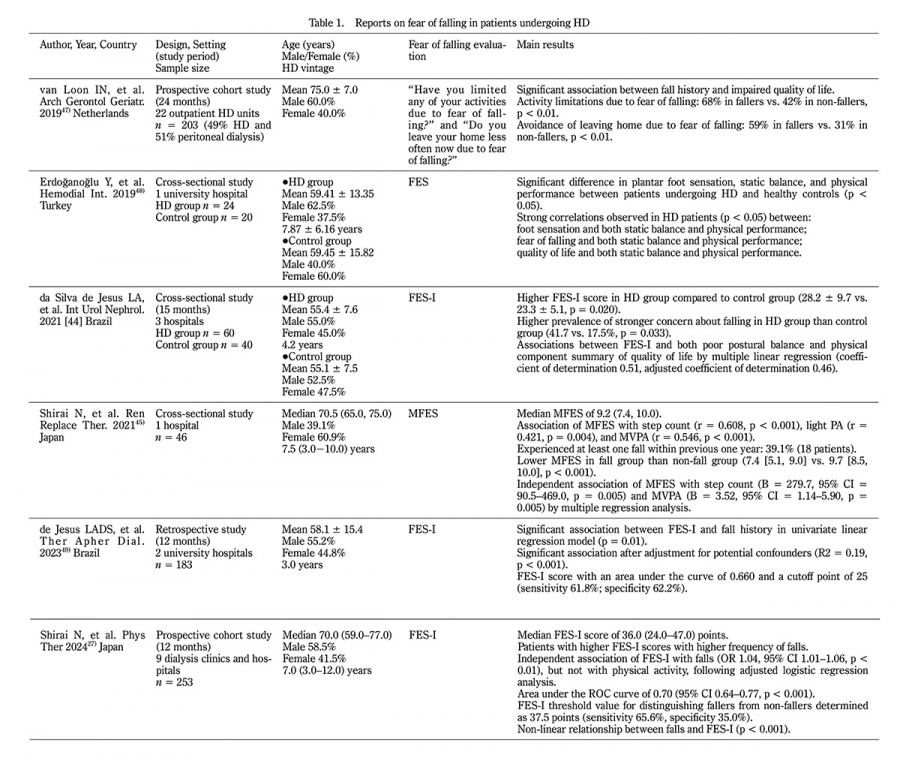
Table 1.
Reports on fear of falling in patients undergoing HD
HD, hemodialysis; FES-I, Falls Efficacy Scale-International; FES, Falls Efficacy Scale; MFES, Modified Falls Efficacy Scale; OR, odds ratio; CI, confidence interval
Prevalence of FOF in patients undergoing HD
Patients undergoing HD have stronger FOF than community-dwelling older people, particularly among those with a history of falls or who are at risk of future falls. da Silva de Jesus et al. reported that FES-I scores were higher in the patients undergoing HD compared to age- and sex-matched individuals without CKD (28.2 ± 9.7 vs. 23.3 ± 5.1, p = 0.020). Furthermore, the prevalence of strong FOF was higher in patients undergoing HD (41.7% vs. 17.5%, p = 0.033). These findings indicate that patients undergoing HD have less confidence in performing activities of daily living without falling47). According to Shirai et al.’s study, 39.1% of patients undergoing HD experienced at least one fall within the previous year, and showed lower MFES scores and stronger FOF compared to patients undergoing HD without a history of falls (falls group, 7.4 [interquartile range 5.1, 9.0] points, vs. non-falls group, 9.7 [8.5, 10.0] points, p < 0.001)48). Furthermore, Shirai et al. reported that as the FES-I score increased, the likelihood of future falls increased, and the falls group had higher scores than the non-falls group for all FES-I items (p < 0.01 – p < 0.001)27). These findings suggest increased FOF among patients undergoing HD and a high possibility of association between FOF and falls Furthermore, it has been reported that increased FOF in patients undergoing HD may be associated with reduced physical activity and impaired physical function (Table 1).
Relationship between FOF and physical activity in patients undergoing HD
There may be a bidirectional relationship between increased FOF and decreased physical activity in patients undergoing HD. van Loon et al. reported that 68% of fallers limited their activities due to FOF compared to 42% of non-fallers (p < 0.01). Additionally, fallers were significantly more likely than non-fallers to report leaving the house less often due to FOF (59% vs. 31%, p < 0.01) 49). Furthermore, in a report by Shirai et al. a negative correlation was observed between FES-I and total physical activity assessed using the International Physical Activity Questionnaire short form (r = –0.41, p < 0.001)27). They also reported that MFES was significantly associated with the number of steps (B = 279.738, 95% CI = 90.478–468.998, p = 0.005) and physical activity of ≥ 3 Metabolic equivalents (METs) (B = 3.521, 95% CI = 1.142–5.901, p = 0.005) 48).
Relationship between FOF and physical function in patients undergoing HD
FOF in patients undergoing HD may be related to physical function. Erdoğanoğlu et al. reported that FOF showed a positive correlation with both static balance assessed using the single-leg standing test (r = 0.300, p = 0.001) and physical performance assessed using the Timed Up and Go test (r = 0.700, p = 0.001)50). In addition, Shirai et al. reported that there was a negative correlation between the FES-I and lower limb physical performance assessed by the Short Physical Performance Battery (r = –0.59, p < 0.001)27). da Silva de Jesus et al. reported that FES-I scores were independently associated with poor postural balance as assessed by the Mini-BESTest score (B = 1.216, CI = –2.064 to –0.368, p = 0.006) and physical components of QOL as assessed by the SF-36 (B = –0.427, CI = –0.602 to –0.251, p < 0.001)47).
Relationship between FOF and falls in patients undergoing HD
FOF in patients undergoing HD may be associated with past and future falls. da Silva de Jesus et al. reported that FOF was associated with fall history (B = 4.872, CI = 1.693 to 8.051, p = 0.003), and the FES-I cutoff value to distinguish between fallers and non-fallers was 25 points (sensitivity 61.8%, specificity 62.2%), with an area under the ROC curve of 0.66051). Shirai et al. reported that FOF was associated with future falls (OR 1.04, 95%CI 1.01–1.06, p = 0.003), and the FES-I cutoff value to distinguish between fallers and non-fallers was 37.5 points (sensitivity 65.6%, specificity 35.0%), with an area under the ROC curve of 0.70 (95% CI 0.64–0.77, p < 0.001). In addition, a relationship was observed between falls and FES-I when the cut-off value of the ROC curve was used as the reference, and it has been confirmed that the risk of falls increases sharply when the cut-off value is exceeded27).