Over the past ten years, a questionnaire was sent to 138,237 pregnant women in Fukushima Prefecture. The response rate was 50.6%, with 70,015 responses (Figure 2). A total of 357 invalid responses (63 without answers, 1 participant death, 83 multiple responses, 209 inconsistent answers, and 1 canceled registration after reply) were excluded, and 69,658 participants were included in the study. Of these, 68,548 individuals participated in this analysis after the exclusion of 459 participants whose deliveries had occurred before the disaster, 165 participants who were pregnant while answering, 58 participants who had induced abortions, and 425 participants who had spontaneous abortions and 3 participants who had triplets (Figure 2).
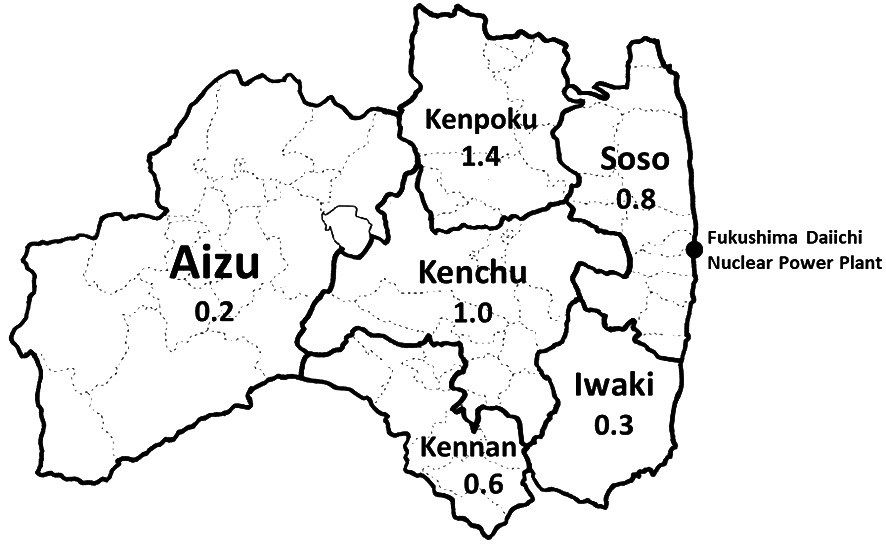
In the first year (2011), the number of participants was 15,972, which decreased to 14,420 in 2012 and then temporarily increased to 15,108 in 2013. Subsequently, the number gradually decreased every year, reaching 11,289 in 2020 (Table 1). The response rate was relatively high at 58.2% in the first year, but fluctuated around 50% in subsequent years and finally reached 55.5% in 2020. The rates differed significantly by region and year. Kenpoku had a higher response rate than other areas. Soso, located closest to the Fukushima Daiichi Nuclear Power Plant, had a higher response rate only in 2011, and has remained lower since then (Table 1).
Table 2 shows the participants’ characteristics based on the years since delivery. Significant differences were observed in maternal age, gestational week at delivery, mode of pregnancy, and sex of neonates over the decade. Maternal age and cesarean section rate increased, while natural pregnancy rate decreased significantly over time (Table 2).
Table 3 shows that no significant differences were observed in the incidence of preterm deliveries based on the region and year. Regional differences were observed only in 2012, when the incidence was lower in Kenpoku and higher in Aizu.
Table 4 shows the incidence of LBW infants by region and year. No significant differences were observed in Fukushima Prefecture as a whole. Regional differences were only observed in 2011 and 2012. In 2011, the incidence was lower in Kenpoku and higher in Iwaki, whereas in 2012, the incidence was lower in Kenpoku and higher in Aizu.
Table 5 presents the incidence of congenital anomalies in newborns in each district over time. It ranged from 2.19% to 2.85% in Fukushima Prefecture, with no significant change over time. Different regions showed no significant changes over time.
Table 6 shows changes in the incidence of each anomaly over time. Cardiac malformation was the most common anomaly in Fukushima Prefecture, with an incidence rate of 0.61%-1.01%. No significant changes were observed in the incidence of all anomalies over time.
The onset of microcephaly and spina bifida is thought to be caused by radiation exposure. Tables 7 and 8 show the incidences of microcephaly and spina bifida, respectively, in each district over the study period. In 2011, 2012, 2014, and 2019, sporadic cases of microcephaly in newborns were reported in Kenchu. While 0-5 cases of spina bifida in newborns were observed every year in the Fukushima Prefecture, no chronological or regional fluctuations were observed.
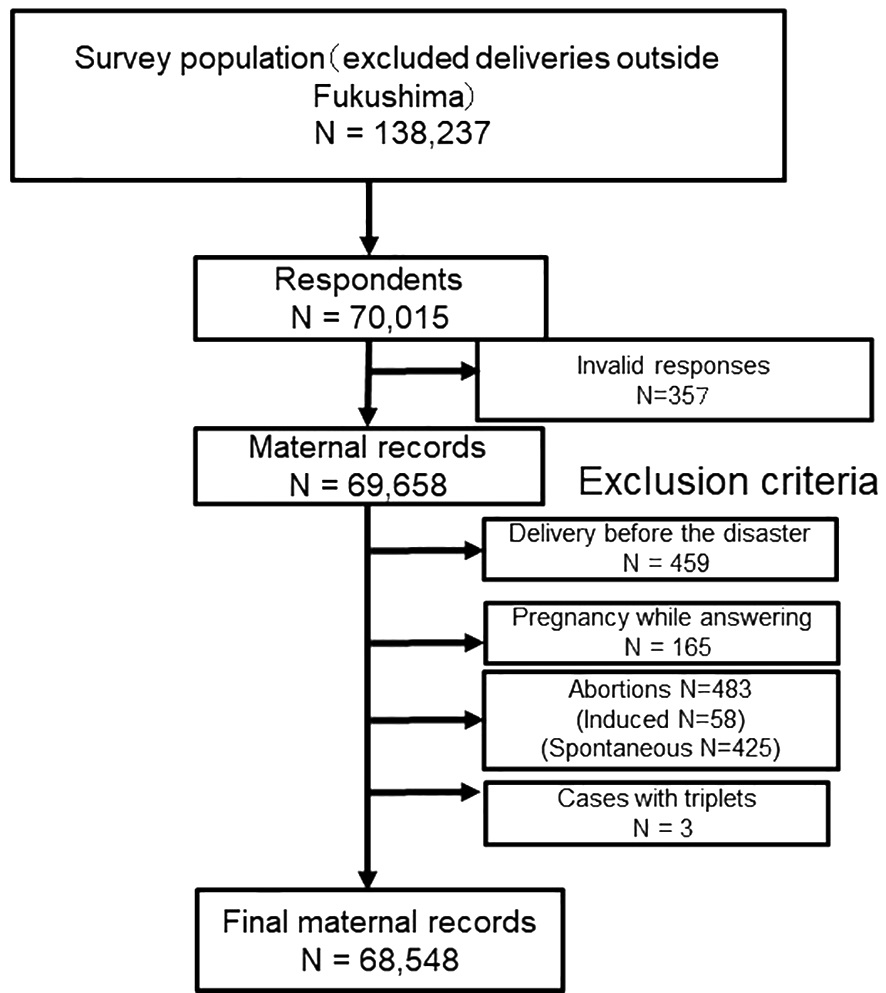
Fig. 2.
Flowchart showing study enrollment
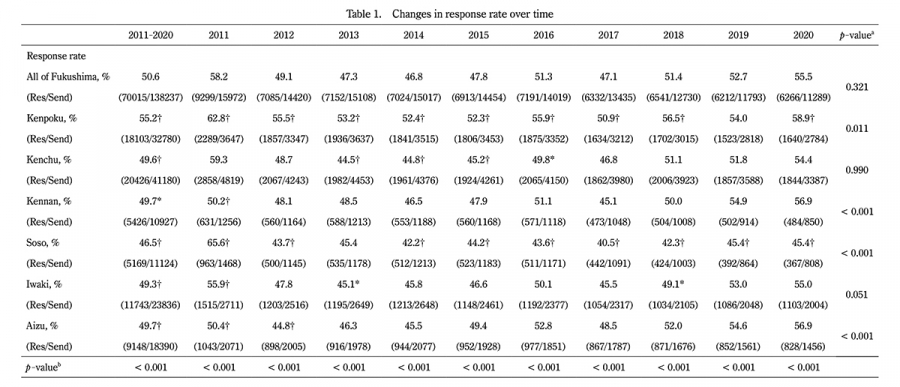
Table 1.
Changes in response rate over time
a P-value was calculated using the Extended Mantel Haenszel Chi Square for linear trends.
bp-value was calculated using the chi-square test.
† indicates p < 0.01, * indicates p < 0.05
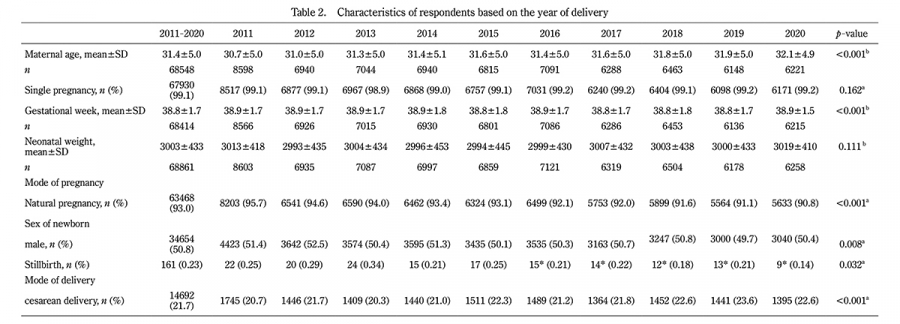
Table 2.
Characteristics of respondents based on the year of delivery
* Not including confirmed abortions and stillbirths or neonates not confirmed to have survived before sending the questionnaires.
a P-value was calculated using the Extended Mantel Haenszel Chi Square for linear trends.
b p-value was calculated using the Jonckheere-Terpstra trend test.
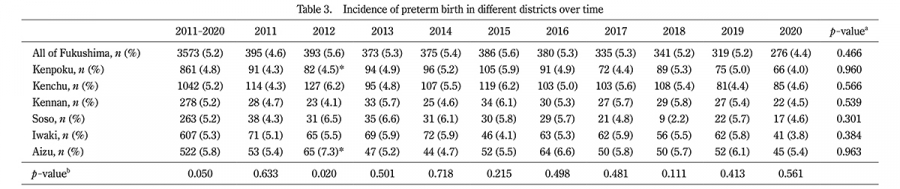
Table 3.
Incidence of preterm birth in different districts over time
a P-value was calculated using the Extended Mantel Haenszel Chi Square for linear trends.
b p-value was calculated using the chi-square test.
* indicates p < 0.05
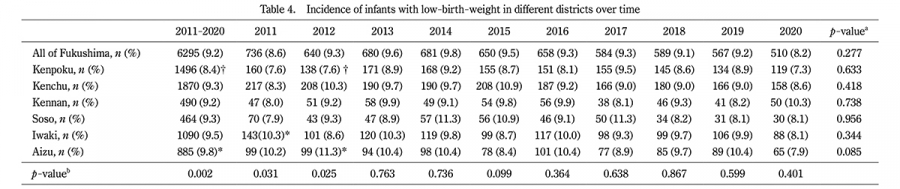
Table 4.
Incidence of infants with low-birth-weight in different districts over time
a P-value was calculated using the Extended Mantel Haenszel Chi Square for linear trends.
b p-value was calculated using the chi-square test.
† indicates p < 0.01, *indicates p < 0.05
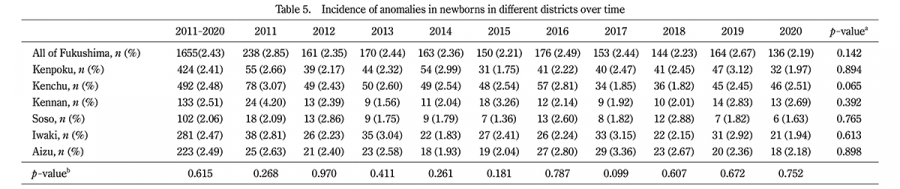
Table 5.
Incidence of anomalies in newborns in different districts over time
a P-value was calculated using the Extended Mantel Haenszel Chi Square for linear trends.
b p-value was calculated using the chi-square test.
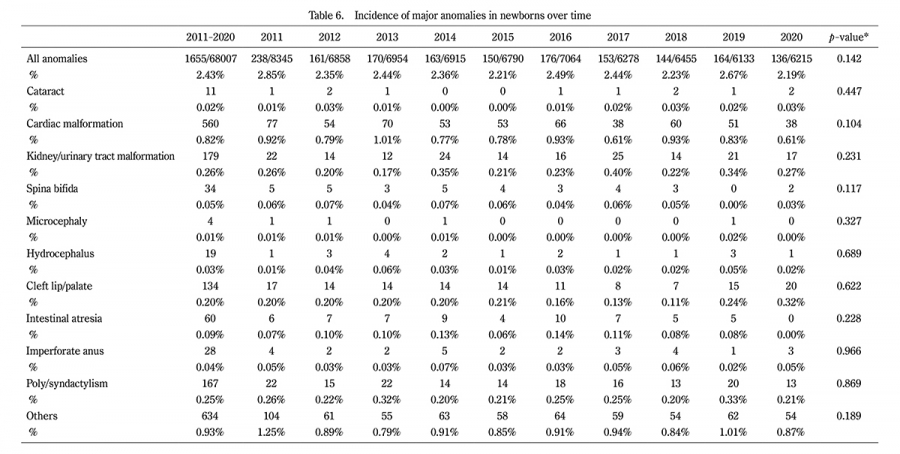
Table 6.
Incidence of major anomalies in newborns over time
a P-value was calculated using the Extended Mantel Haenszel Chi Square for linear trends.
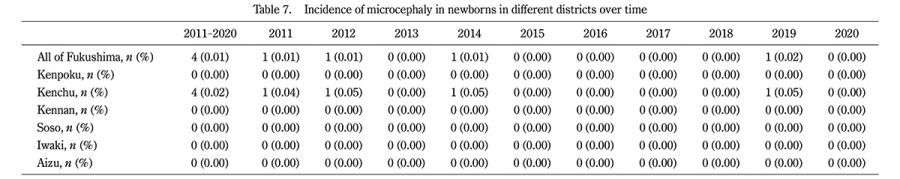
Table 7.
Incidence of microcephaly in newborns in different districts over time

Table 8.
Incidence of spina bifida in newborns in different districts over time
a P-value was calculated using the Extended Mantel Haenszel Chi Square for linear trends.
b p-value was calculated using the chi-square test.