1. Demographic characteristics of participants and comparison of higher-level functional capacities by sex
The participant characteristics are summarized in Table 1. The cohort was predominantly female, and there was no significant difference between the sexes regarding mean age. The TMIG-IC scores were significantly higher in the women than in the men, despite a significant difference between the sexes regarding the distribution of education levels, with the most common education backgrounds being university-level among the men and high school-level among the women.
The results of the GDS-15 and TDAS by sex are shown in Table 2. Among the total cohort of 118 participants, 47 scored ≥ 5 on the GDS-15, indicating depressive symptoms/depression. On the TDAS, 10 participants scored ≥ 14, which is indicative of possible dementia, whereas 22 scored 7-13, which is indicative of MCI. There were no significant differences between the sexes regarding the GDS-15 and TDAS scores.
The demographic characteristics of the participants who had both depressive symptoms/depression or possible dementia (n= 51) and those who did not (n= 67) were compared (Table 3), revealing no significant differences regarding age, sex ratio, or educational background. However, a comparison of TMIG-IC scores between those with depressive symptoms and those without showed that the latter scored significantly higher than the former.
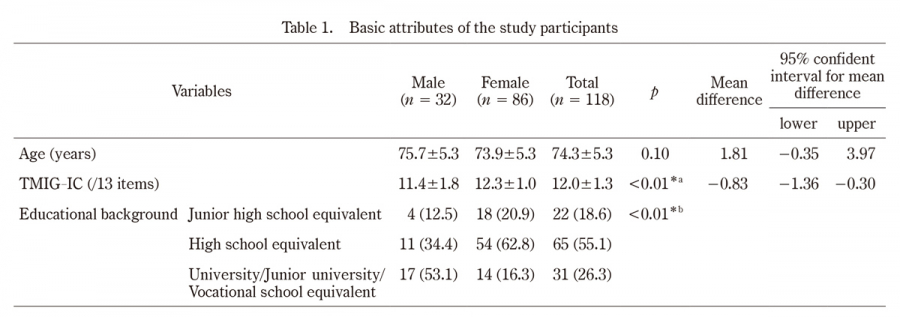
Table 1.
Basic attributes of the study participants
TMIG-IC, Tokyo Metropolitan Institute of Gerontology Index of Competence
Values are presented as n(%).
Statistical test;*a Independent t-test, *b Fisher’s exact test.
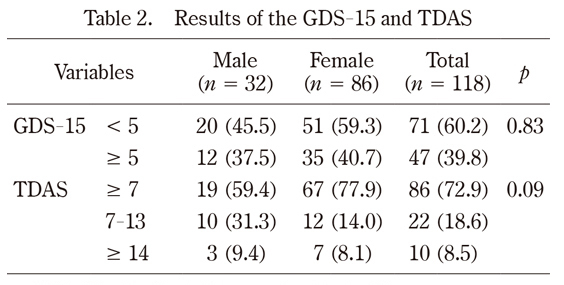
Table 2.
Results of the GDS-15 and TDAS
GDS-15;Geriatric Depression Scale-15
TDAS;Touch Panel-type Dementia Assessment Scale
Values are presented as n(%)
Statistical test;Fisher’s exact test
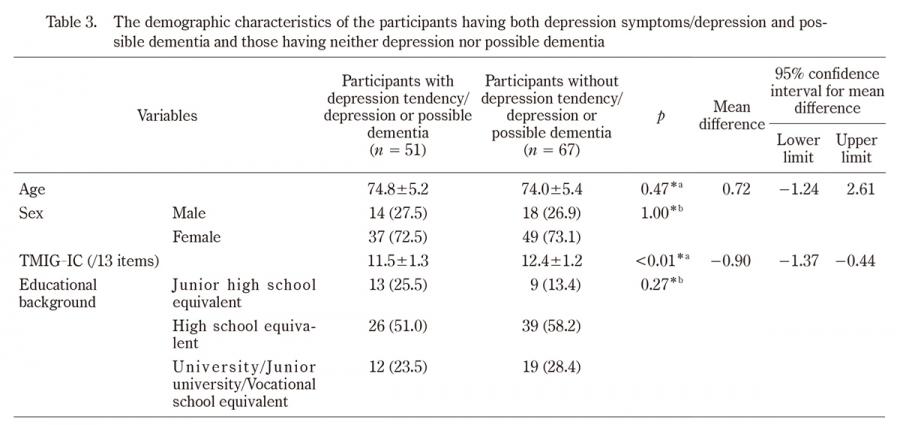
Table 3.
The demographic characteristics of the participants having both depression symptoms/depression and possible dementia and those having neither depression nor possible dementia
TMIG-IC;Tokyo Metropolitan Institute of Gerontology Index of Competence
Values are mean ± SD or n(%).
Statistical test;*a Independent t-test, *bFisher’s exact test
2. Comparison of demographic characteristics between the MCI and non-MCI groups
The 67 participants without depressive symptoms or possible dementia were divided into an MCI group (n= 16) and a non -MCI group (n= 51), as described previously. The mean age of the MCI group was significantly higher than that of the non-MCI group and included a significantly greater proportion of males. The TMIG-IC scores and instrumental self-maintenance were lower in the MCI group than in the non-MCI group. There were no significant differences in intellectual activities, social roles, or educational background between the groups (Table 4).
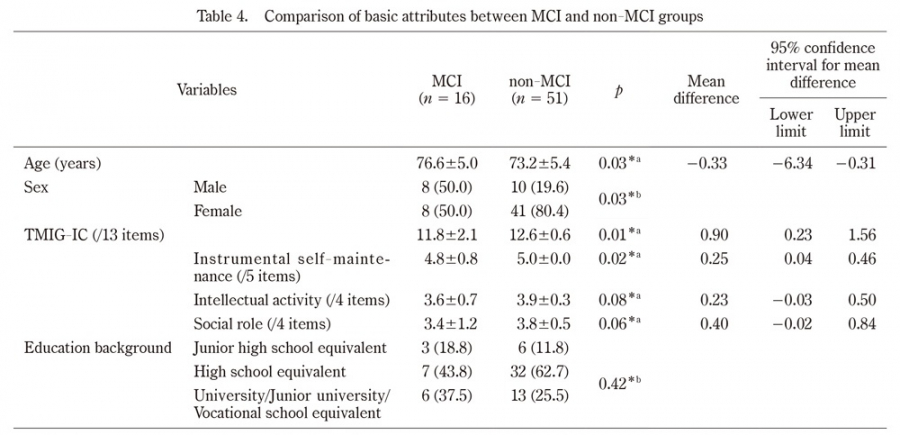
Table 4.
Comparison of basic attributes between MCI and non-MCI groups
MCI;mild cognitive impairment, TMIG-IC;Tokyo Metropolitan Institute of Gerontology Index of Competence
Values are mean ± SD or n(%).
*a Independent t-test. *b Fisher’s exact test.
3. Comparisons of higher-level functional capacity scores between the MCI and non-MCI groups
Comparisons of each variable (Table 5) showed a significant difference in the proportion of negative responses (“no”) to one of the questions about social roles (“Are you sometimes called on for advice?”), which was higher in the MCI group compared to the non-MCI group.
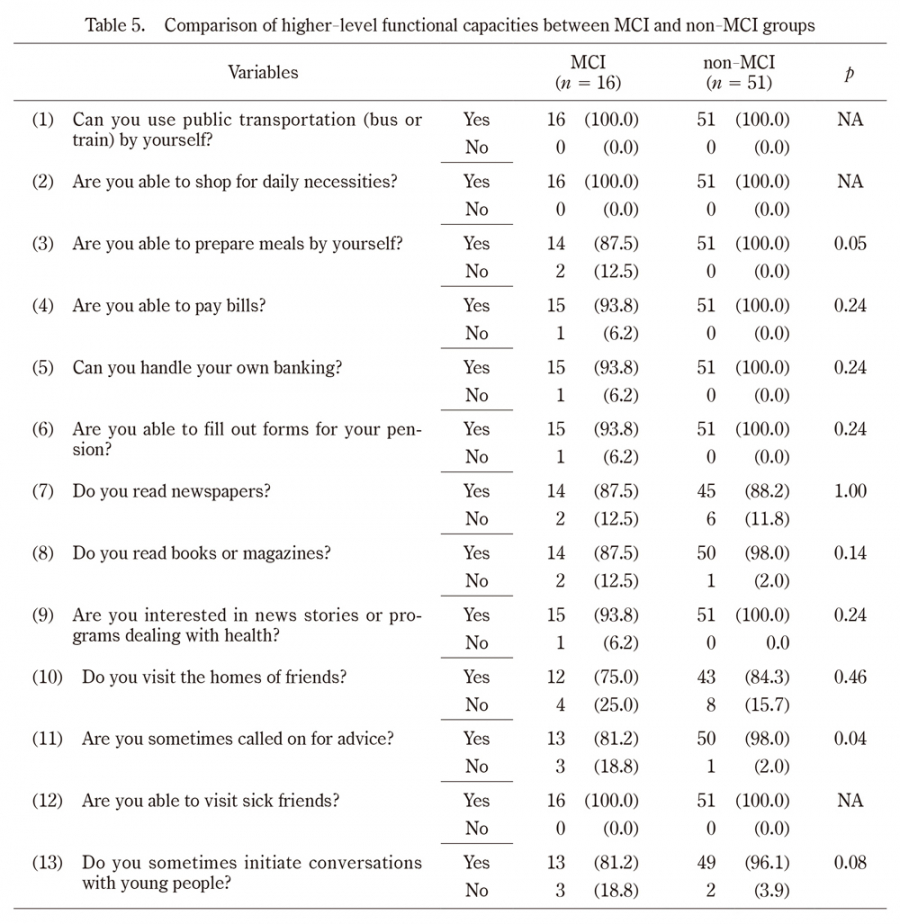
Table 5.
Comparison of higher-level functional capacities between MCI and non-MCI groups
MCI;mild cognitive impairment
Values are presented as n(%)
NA;not applicable
Statistical test;Fisher’s exact test
4. Comparison of subjective difficulty with higher-level functions between the MCI and non-MCI groups
Table 6 shows the rates of subjective difficulty with higher-level functions compared to five years earlier in the MCI and non-MCI groups. Significant differences were observed in two variables, with higher rates in the MCI group:“Are you able to prepare meals by yourself?” and “Are you able to fill out forms for your pension?”.
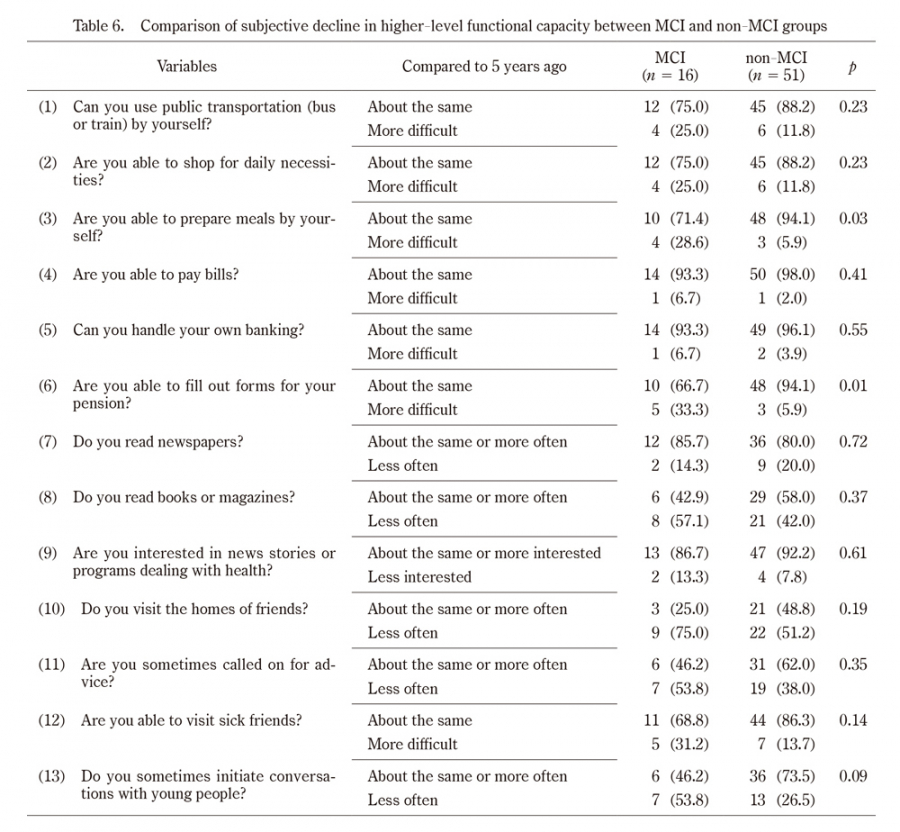
Table 6.
Comparison of subjective decline in higher-level functional capacity between MCI and non-MCI groups
MCI;mild cognitive impairment
Values are presented as n(%).
Inappropriate responses were excluded from analysis.
Statistical test;Fisher’s exact test
5. Logistic regression analysis
Logistic regression analysis, using MCI and non-MCI as dependent variables, and sex, age, and TMIG-IC as independent variables, revealed that the only significant variable was TMIG-IC (p= 0.03), with an odds ratio of 0.59 (95% confidence interval [CI] :0.37-0.94), indicating that a 1-point higher TMIG -IC score is associated with an approximately 0.6-fold increase in the likelihood of MCI (Table 7).
In a logistic regression analysis using sex, age, and TMIG instrument self-maintenance score as independent variables, sex was a significant variable (p= 0.02). The odds ratio was 0.24, and the 95% CI was 0.07-0.81. Being female increased the odds of developing MCI by 0.25 times (Table 8).
The results of the logistic regression analysis using the TMIG sub-item “Are you sometimes called on for advice? “as the independent variable, with 0 for “no” and 1 for “yes” revealed that the only significant variable was the TMIG sub-item (p= 0.04). The odds ratio was 0.09 (95% CI:0.01-0.90), indicating that a participant who was called on for advice had a lower probability of having MCI (Table 9).
The independent variable was TMIG’s sub-item “Are you able to prepare meals by yourself?” with the answers 0 for “About the same as 5 years ago” and 1 for “Slightly more difficult than 5 years ago” or “Much more difficult than 5 years ago”. The results of the logistic regression analysis revealed that the significant variables were subjective difficulty level (p= 0.01) and sex ( p= 0.02). The odds ratios were 12.67 (95% CI:2.06-77.96) and 0.18 (95% CI:0.04-0.74), indicating that participants who had increased subjective difficulty preparing meals for themselves had a 12-fold higher probability of having MCI. Moreover, being female increased a participant’s odds of developing MCI by 0.20 times (Table 10).
Logistic regression was performed using the TMIG sub-item “Are you able to fill out the pension form” as the independent variable, with 0 being “about the same as 5 years ago” and 1 being “a little more difficult than 5 years ago” or “much more difficult than 5 years ago”. The results of the analysis showed that the significant variables were subjective difficulty level (p< 0.01) and sex ( p= 0.01). The odds ratios were 13.87 (95% confidence interval 2.38-80.71) and 0.17 (95% confidence interval 0.04-0.69), meaning that those with increased subjective difficulty in filling out documents had an approximately 14-fold increased probability of MCI. Furthermore, being female was a factor that increased the likelihood of developing MCI by approximately 0.20 times (Table 11).
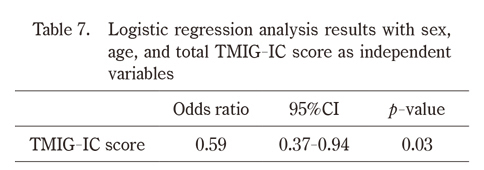
Table 7.
Logistic regression analysis results with sex, age, and total TMIG-IC score as independent variables
CI:confidence interval.
Statistical test;logistic regression analysis, using MCI and non-MCI as dependent variables, and sex, age and TMIG Index of Competence score as independent variables
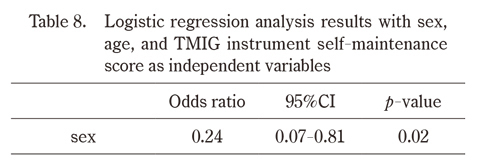
Table 8.
Logistic regression analysis results with sex, age, and TMIG instrument self-maintenance score as independent variables
CI:confidence interval.
Statistical test;logistic regression analysis, using MCI and non-MCI as dependent variables, and sex, age and TMIG instrument self-maintenance score as independent variables
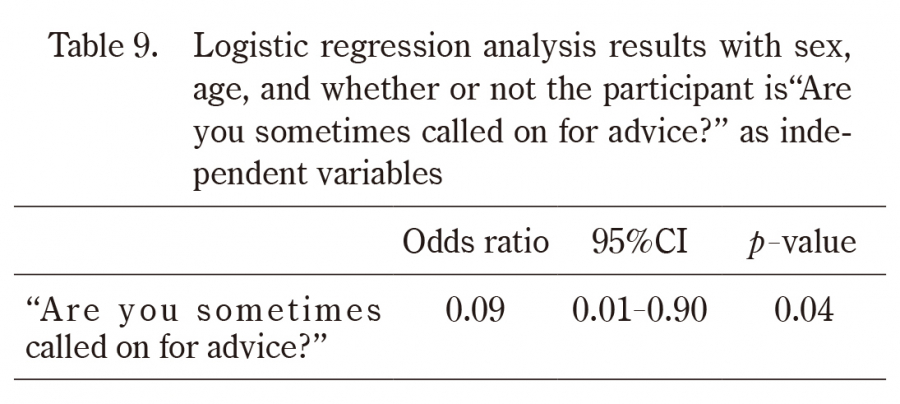
Table 9.
Logistic regression analysis results with sex, age, and whether or not the participant is“Are you sometimes called on for advice?” as independent variables
CI:confidence interval.
Statistical test;logistic regression analysis, using MCI and non-MCI as dependent variables, and sex, age and TMIG’s sub-item “Are you sometimes called on for advice?” as independent variables
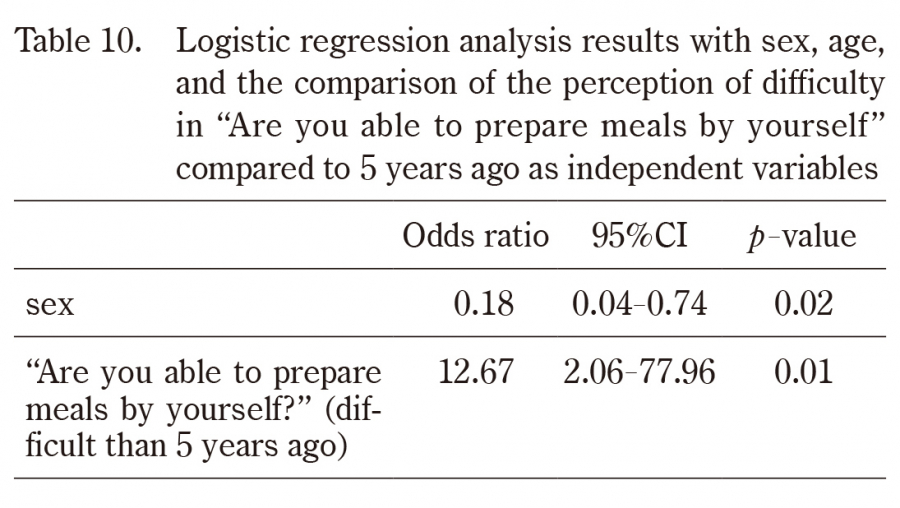
Table 10.
Logistic regression analysis results with sex, age, and the comparison of the perception of difficulty in “Are you able to prepare meals by yourself” compared to 5 years ago as independent variables
CI:confidence interval.
Statistical test;logistic regression analysis, using MCI and non-MCI as dependent variables, and sex, age and TMIG’s sub-item “Are you able to prepare meals by yourself?”
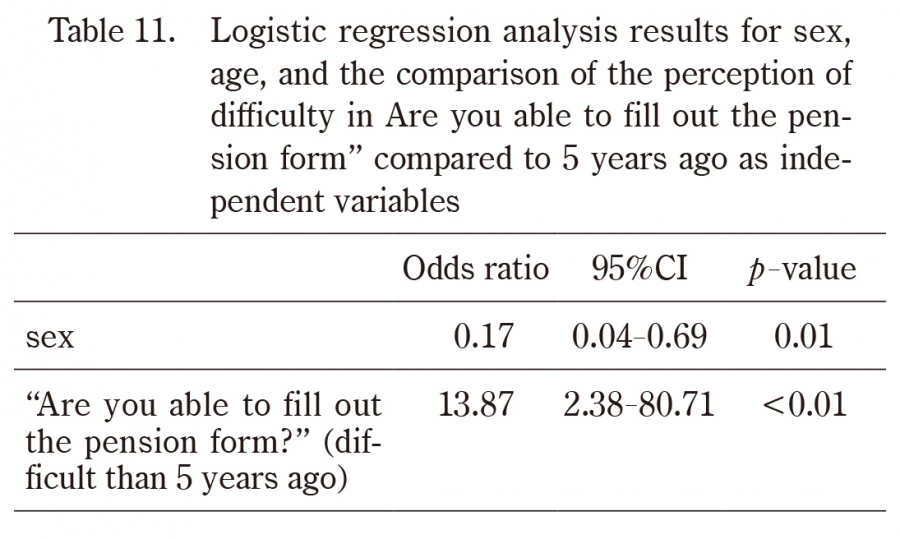
Table 11.
Logistic regression analysis results for sex, age, and the comparison of the perception of difficulty in Are you able to fill out the pension form” compared to 5 years ago as independent variables
CI:confidence interval.
Statistical test;logistic regression analysis, using MCI and non-MCI as dependent variables, and sex, age and TMIG’s sub-item “Are you able to fill out the pension form?”