The content of research paper

Histological outcome evaluation of selected brain preparation protocols for white fiber dissection

Masayuki Yamada, Kenichiro Iwami, Mudathir Bakhit, Masahiro Okamoto, Kiyoshi Saito, Masazumi Fujii

Author information
  • Masayuki Yamada

    Department of Neurosurgery, Fukushima Medical University

  • Kenichiro Iwami

    Department of Neurosurgery, Aichi Medical University

  • Mudathir Bakhit

    Department of Neurosurgery, Fukushima Medical University

  • Masahiro Okamoto

    Department of System Neuroscience, Fukushima Medical University

  • Kiyoshi Saito

    Department of Neurosurgery, Fukushima Rosai Hospital

  • Masazumi Fujii

    Department of Neurosurgery, Fukushima Medical University

1. Introduction

The brain is a complex network. To understand certain functions of the brain, both the anatomical localization of the function and its connectivity must be ascertained1). It is difficult for learners to understand the whole structure of the fiber tract three-dimensionally due to its complexity. Fortunately, this issue is solved via white matter dissection, a practical method to study the brain’s structural connections. It enables a thorough anatomical understanding since the white matter tract connections are examined in vivo and in three-dimensional (3D) fields2-4). Recently discovered white matter structures, such as the frontal aslant tract and the subcomponents of the superior longitudinal fasciculus, were initially reported based on magnetic resonance imaging studies5-7). To validate these imaging results, confirmatory white matter dissection studies have been performed8,9). These reports help understand white matter structure and function through white matter dissection.


The original method for white matter dissection was introduced by Klingler et al.10)and is being widely used. The Klingler method mainly involves two steps of brain sample preparation. The first step is formalin fixation, and the second is the freezing and thawing process. Each research group follows the original procedure;however, a detailed protocol involving processes such as duration of fixation, freezing time and temperature, and frequency of freezing and thawing are varied. Regarding brain fixation, many studies agree that prolonged fixation is favorable11). However, the freezing condition has many variations, and there is no validation of the optimal condition11).


The Klingler method is based on the principle of ice crystal formation between fibers, which leads to the separation of these fibers without their destruction. An electron microscopy study confirmed that the freezing process does not affect the structural integrity of white matter fibers, since ice crystals form in the extra-axonal space and, therefore, do not damage the myelin sheaths12). Thus, maximizing ice crystal production is critical in the Klingler method. It is hypothesized that larger crystals cause the fibers to be more easily dissectible. However, no scientific reports currently exist that prove this hypothesis. Moreover, no scientific reports describe which freezing setup and protocol is optimum for fiber dissection. Accordingly, the current study was designed to evaluate the formation and growth of ice crystals alongside the fibers under various freezing conditions. We aimed to validate the effect of different freezing protocols and to illustrate and compare the freezing condition in the Klingler method based on histological examination.

Material and Methods

Brain sample preparation


The brain samples used in this study were donated by the Department of Anatomy, Fukushima Medical University. Sixty cerebral hemispheres from anonymous donors were used. Formalin (37% formaldehyde aqueous solution;Koei Chemical Co., Ltd., Tokyo, Japan) was used for brain fixation. After death was confirmed, diluted 4% formalin was flushed through the donors’ femoral arteries. Within 48 h after death, brain samples were harvested and submerged in 10% formalin for 3 days and then in diluted 4% formalin for one to 3 months. These formalin-fixed samples were then allocated to one of ten freezing protocol groups:formalin-fixed (P1), 1-week continuous freeze (P2), 2-week continuous freeze (P3), 3-week continuous freeze (P4), 4-week continuous freeze (P5), 5-week continuous freeze (P6), two cycles of 1-week continuous freeze separated by a 6-hour thaw period (P7), three cycles of 1-week continuous freeze separated by 6-hour thaw periods (P8), four cycles of 1-week continuous freeze separated by a 6-hour thaw periods (P9), and five cycles of 1-week continuous freeze separated by 6-hour thaw periods (P10). Six hemispheres were allocated to each protocol. For freezing, each hemisphere was wrapped in gauze and cellophane film and stored at −5°C. For thawing, the hemispheres were transferred into a bucket and placed under running tap water for 6 hours.


Following thawing, each hemisphere underwent slicing into six 5-mm sections, with three positioned anteriorly and three posteriorly to the central sulcus (Fig.1A). Subsequently, within each of these six slices, three distinct regions were delineated for further preparation and analysis, predominantly encompassing U-fibers and long fibers located at the (1) ventral operculum, (2) temporal lobe, and (3) dorsal operculum (Fig.1B). These three designated regions were then embedded in paraffin, with each subsequently sliced into 6-μm sections and subjected to hematoxylin-eosin (H&E) staining, as illustrated in Fig.2. The resultant images were digitally scanned using the Keyence BZ-X700 digital microscope (Keyence Corporation, Osaka, Japan) and transferred to image processing software (Fig.3A). These digitized images served as the basis for subsequent analyses, including the assessment of gap ratio and eccentricity (further described below).
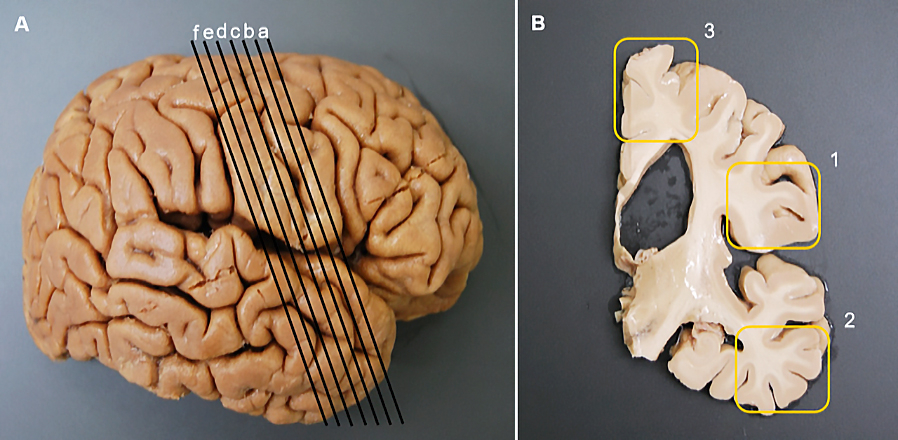


Fig. 1.

Brain sample preparation. Samples were obtained from 60 hemispheres. Each sample was cut in the coronal plane at 5-mm intervals anterior and posterior to the central sulcus (A). For the histological study, three sections (yellow box frames), one each from the 1) ventral operculum, 2) temporal lobe, and 3) dorsal operculum, were collected from each original slice (B).
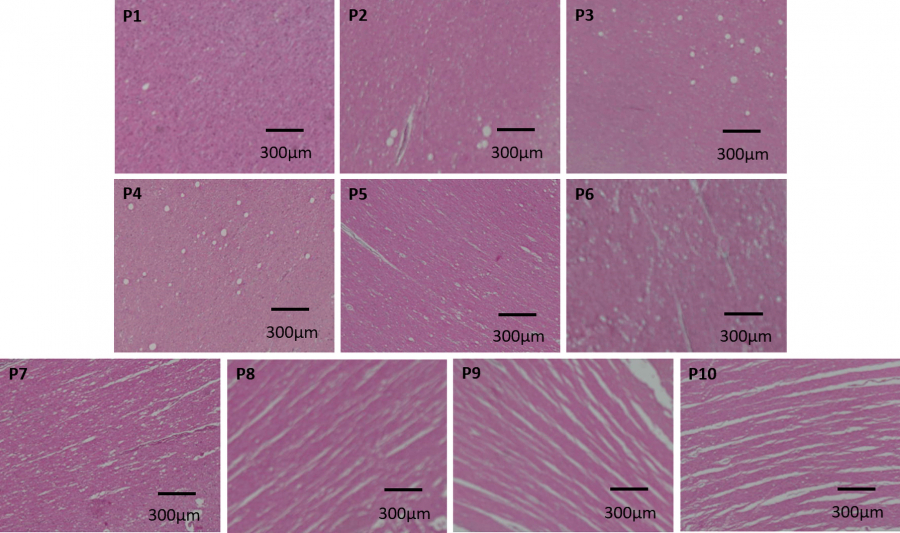


Fig. 2.

Hematoxylin-eosin (H&E)-stained brain samples that underwent different freezing protocols. Formalin-fixed (P1), 1-week continuous freeze (P2), 2-week continuous freeze (P3), 3-week continuous freeze (P4), 4-week continuous freeze (P5), 5-week continuous freeze (P6), two cycles of 1-week continuous freeze separated by a 6-hour thaw period (P7), three cycles of 1-week continuous freeze separated by 6-hour thaw periods (P8), four cycles of 1-week continuous freeze separated by 6-hour thaw periods (P9), and five cycles of 1-week continuous freeze separated by 6-hour thaw periods (P10). The degree of separation created by the formation of ice crystals between the axons is evident in the freeze-thaw protocols, particularly in the P8, P9, and P10 samples, while the freeze-only protocols (P2-P6) lack this separation.


Data processing


The images of the H&E-stained specimens were segmented and analyzed using the MATLABⓇImage Processing Toolbox TMapplication (MathWorks, Natick, MA, USA). Using the Image Segmenter application, white matter regions were selected and extracted from the scanned images (Fig.3B). The RGB colors of the digital images were converted into grayscale signals. Image contents were then categorized as either white matter fibers or gaps, where gaps were depicted in white (Fig.3C).
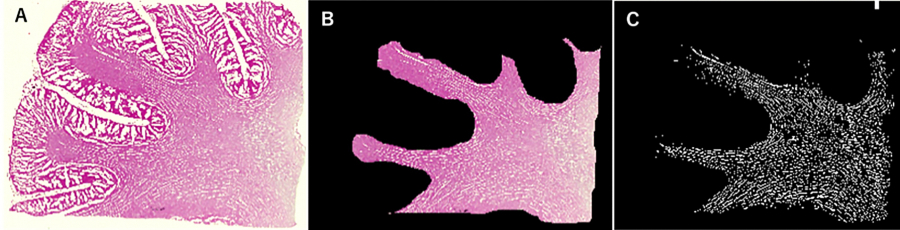


Fig. 3.

Slice image processing. Scanned images (A) were processed using the Image Segmenter software. White matter regions (B) and gap areas (C;white areas) were identified.


Assessment of specimens


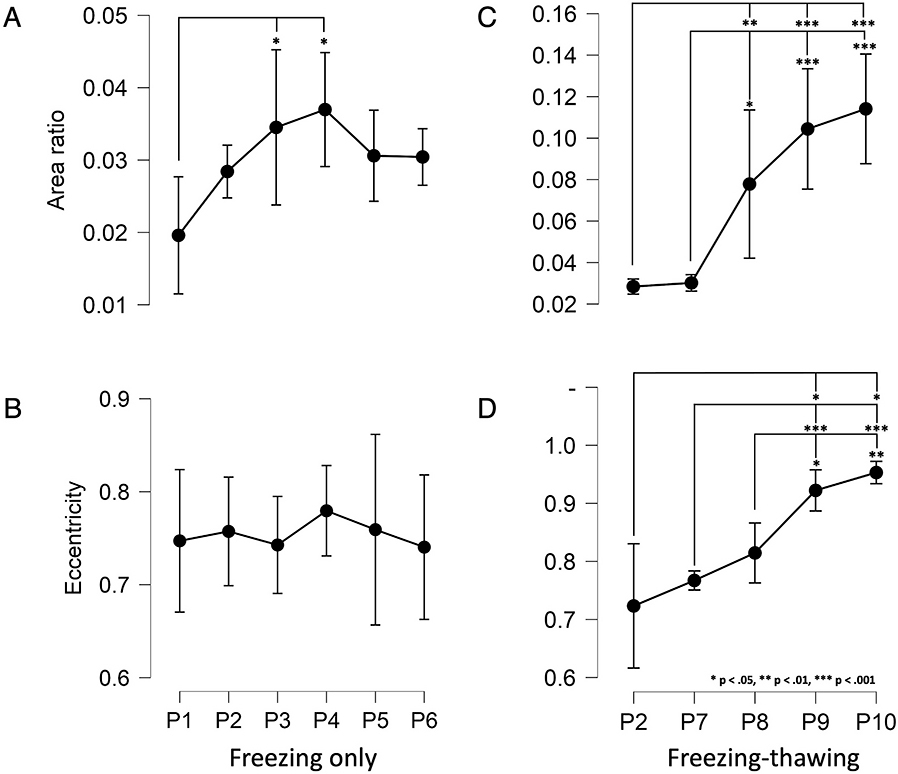
Eccentricity is an anisotropy index. The mean eccentricity (e) of the gaps was measured to assess the direction of separation. The eccentricity of an ellipse is always between zero and one. An eccentricity of zero indicates an isotropic state (round shape) and as eccentricity approaches a value of one, anisotropy becomes significant (Fig.4). When an ice crystal separates the fibers along their axis, the eccentricity of the gap increases.


The ratio of total gap areas to white matter areas was also assessed to measure and evaluate the degree of fiber separation. The ratio was calculated by dividing the gap area (white area in Fig.3C) by the designated white matter area (Fig.3B).
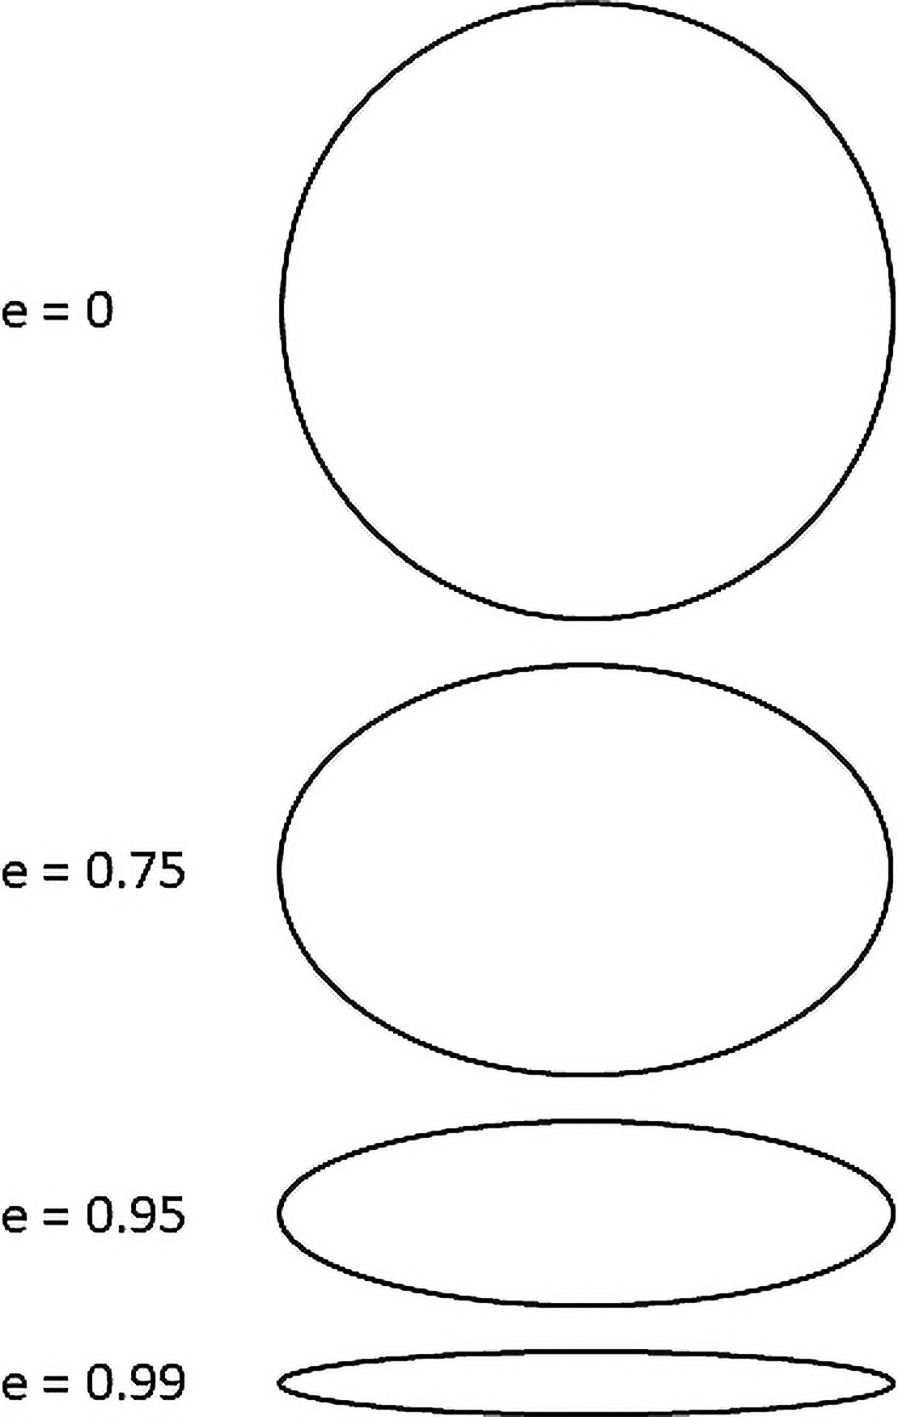


Fig. 4.

Eccentricity measurement. An eccentricity of zero is depicted as a spherical shape, which represents an isotropic state. As eccentricity increases, anisotropy also increases.


Statistical analyses


A standard one-way analysis of variance (ANOVA) was used to detect significant differences between the gap area ratios and eccentricity values between protocol groups. If the assumption of the equality of variance was violated, a Welch ANOVA was used. Specific significant results were then identified through a post hoc analysis of pairwise comparisons between all groups. If a Welch ANOVA was used, then the Games-Howell post hoc test was employed. First, differences in the frozen-only samples (P2-P6), including the formalin-fixed samples (P1), were analyzed, followed by the freeze-thaw samples (P7-P10), including the 1-week continuous freeze (P2) samples.


Data were checked for outliers, and normality was assessed using the Shapiro-Wilk test. Descriptive data are expressed as mean ± standard deviation, while results of the ANOVA and post hoc tests are expressed as mean ± standard error. Significance in all tests was set at p < 0.05. The JASP software, version 0.15, was used for all analyses.

Results

The H&E images


The H&E images depicting each freezing protocol can be found in Fig.2. In continuous freezing protocols (P2-P6), the number of dots-shaped gaps gradually increased in the white matter area over time, but the gaps were very small, and the change was insignificant. On the other hand, multiple cycles of the freeze-thaw process resulted in ellipse gaps parallel to the fibers in the white matter area, and with each repetition, the gaps became longer.


Descriptive data


The descriptive data regarding area ratios and eccentricity values for each protocol are provided in Supplementary Table 1. The data were normally distributed for each group, as assessed using the Shapiro-Wilk test. The differences in area ratios and eccentricity values between the protocols are shown in Fig.5.


Fig. 5.

Descriptive plots of the analysis of variance results and differences between protocols. Significant differences were found in the analysis that included the area ratios of the no-freeze (P1) and the freeze-only (P2-P6) protocols (A). However, there were no significant differences regarding their eccentricity (B). Significant differences were also found in the analysis that included the area ratios of the 1-week freeze-only (P2) and the freeze-thaw (P7-P10) protocols (C) and in their eccentricity values (D). Error bars indicate the 95% confidence intervals. Asterisk symbols represent analyses with significant differences.


Freeze-only, area ratio


The results of the ANOVA indicated the presence of statistically significant differences in the analysis that included area ratios of the formalin-fixed (P1) and the freeze-only protocols (P2-P6), F= 4.6, p= .003, ω2= 0.33 (Supplementary Table 2). The area ratio increased gradually from P1 to P4 and began to decrease in P5 and P6 (Fig. 5A). Post hoc analysis revealed that only the differences between P1 and P3 (p< 0.01) and P1 and P4 (p< 0.01) were statistically significant (Supplementary Table 1).


Freeze-only, eccentricity


Eccentricity values were not significantly different between any of the freeze-only groups (Fig.5B).


Freeze-thaw, area ratio


The results of the ANOVA indicated the presence of statistically significant differences in the analysis that included area ratios of 1-week continuous freeze (P2) and the freeze-thaw protocols (P7-P10), F= 18.84 p< 0.001, ω2= 0.7 (Supplementary Table 2). The area ratio increased gradually from P2 and P7 and from P8 to P10 (Fig. 5C). As shown in Supplementary Table 2, the post hoc analysis revealed significant differences between P2 and P8 (p < 0.01), P2 and P9 (p < 0.0001), P2 and P10 (p < 0.0001), P7 and P8 (p = 0.01), P7 and P9 (p < 0.0001), and P7 and P10 (p < 0.0001).


Freeze-thaw, eccentricity


The results of the ANOVA indicated the presence of statistically significant differences in the analysis that included eccentricity values of the 1-week continuous freeze (P2) and the freeze-thaw (P7-P10) protocols, F= 85.21, p< 0.001, ω2= 0.71 (Supplementary Table 2). Eccentricity gradually increased from P2 to P10 (Fig. 5D). As shown in Supplementary Table 3, the post hoc analysis revealed statistically significant differences between P2 and P9 (p = 0.02), P2 and P10 (p = 0.01), P7 and P9 (p < 0.01) P7 and P10 (p < 0.0001), P8 and P9 (p = 0.01), and P8 and P10 (p < 0.01).

Discussion

There are many variations of the preparation protocols of the Klingler method for white matter dissection. Dziedzic et al. described some of these variations11). The most commonly used reagent in brain fixation is 10% formalin, with fixation periods ranging from 24 h to 3 months, with a fixation period of 1 month or more applied in two-thirds of studies. Although the fixation period differs among research groups, many researchers agree that prolonged fixation is beneficial11). The freezing temperatures ranged between −5 to −80°C. Over 90% of studies adopted the range of −10 to −20°C. The freezing period varied from 8 h to 30 days. Despite the variations in the freezing period, approximately 40% of the studies involved freezing for 2 weeks. Moreover, few researchers performed multiple episodes of freezing and thawing. Despite illustrating the preferences among several research groups, the optimum freezing protocol has still not been standardized.


The current study confirmed that the freezing process of the Klingler method leads to microstructural changes in white matter. Regardless of the duration of continuous freezing, the eccentricity of the ice crystals formed did not show significant changes (Fig.5C). Therefore, the gaps created by these crystals were not formed parallelly with the white matter fibers. However, when freezing was interrupted by multiple thawing stages, both the area ratio and eccentricity value increased significantly (Fig.5B, 5D). This indicates that the ice crystals in the freeze-thaw protocols create gaps that are wide and anisotropic, i.e., they run parallel to the white matter fibers. This is primarily due to the repetition of ice crystal formation, as well as progressive ice crystal growth within the same gap due to the recurrent freeze-thaw cycles, which physically contribute to the splitting of fibers. The process of ice crystal expansion is influenced by the interface structure and diffusion rate of the crystals13-15).


There are three mechanisms of ice crystal expansion. One is through the aggregation of ice crystals, the second is through the absorption of the super-cooled water, and the third is through Ostwald ripening (or coarsening)16,17). The reported fiber separation during the freeze-thaw process is thought to be due to the 10% volume increase observed when water freezes, which creates small gaps in the extra-axonal spaces. However, due to the narrow extra-axonal space, ice crystal diffusion is restricted, and its expansion by aggregation is consequently limited18-20). When a frozen brain is thawed using running water, water fills in the gaps in the white matter. Once the brain is frozen again, this water enables ice crystals to form easily in the already-formed gaps and diffuse into the extra-axonal spaces. These factors may play a role in the growth of ice crystals following re-freezing.


The P9 and P10 protocols had the highest area ratios and eccentricity values, both with significant differences compared with the baseline values (Supplementary Tables 1 and 2). However, the values of the protocols were not significantly different from one another. Therefore, it can be inferred that a protocol of four cycles of 1-week continuous freezes interrupted by 6-hour thaw periods (P9) is enough to achieve sufficient microstructural white fiber separation.

Limitations of the study

The present study has some limitations. Specifically, we should have evaluated the quality, ease of use, or practicality of fiber dissection. This is due to the fact that the quality and usability of fiber dissection largely depend on the condition of the brain at the time of removal, making it challenging to conduct a comparative analysis of fiber dissection quality and usability across different brains.


Furthermore, we did not examine the impact of freezing temperatures on ice crystal formation, despite it being considered one of the contributing factors. Rapid freezing, achieving low temperatures of less than −5°C within a short period, can generate small ice crystals and inhibit their coarsening even over extended periods17,20). This method is ideal for preserving food as it does not alter the tissue significantly since ice crystals typically grow and coarsen between −1 to −5°C20). Going below this range and lowering the temperature even further minimizes the formation of large ice crystals, and any ice crystals that do develop are small. However, this technique is unsuitable for brain fixation, as we require the ice crystals to grow and coarsen to separate the axons. Therefore, a slow and prolonged freezing process at higher temperatures is more appropriate for preparing white matter dissection than rapid freezing. In our research, we adopted this approach and stored the brain at −5°C for several weeks to ensure the development of large and coarse ice crystals. Nonetheless, we lack scientific evidence to verify our hypothesis regarding brain freezing. Hence, future studies are necessary to confirm this aspect.


One notable limitation of our study is the absence of additional staining techniques, such as KB and Bodian staining, to validate the integrity of axons and myelin sheaths. While our methodology aimed to preserve axon and myelin integrity based on existing literature, the lack of direct validation through staining methods represents a gap in our analysis. Future studies should consider incorporating these staining techniques to provide more comprehensive evidence of axon preservation and to further enhance the validity of our findings.


Finally, although it has been noted that multiple iterations of the freezing-thawing cycle can improve the separation of fibers during dissection, accurately quantifying individual experiences during white fiber dissection remains elusive. We recognize the variability in subjective perceptions of dissection ease among practitioners, yet establishing a standardized measure for this aspect proved unfeasible within the confines of our study. As a result, while our research underscores the histological anisotropy of ice crystal-induced gaps and illustrates heightened fiber separation linked to freezing-thawing cycles, our capacity to directly assess and quantify dissection ease across diverse conditions remains constrained.

Conclusion

The current study investigated the impact of freezing protocols, including the Klingler method, on white matter fiber separation. The study focused on the impacts of freezing duration and freeze-thaw cycle frequency, evaluating how different protocols affect white fiber separation. Our study revealed that the protocol involving four cycles of 1-week continuous freeze is the best way to achieve sufficient fiber separation with the smallest number of freezing and the shortest period of freezing. These findings can contribute to the improvement of brain preparation quality for white fiber dissection studies.

Acknowledgments

Brain samples were provided by the Department of Anatomy, Fukushima Medical University. We want to express our gratitude to the donors and to Prof. Hiroyuki Yaginuma for his contribution to this research. The authors sincerely thank those who donated their bodies to science so that anatomical research could be performed. Results from such research can potentially increase mankind’s overall knowledge which can then improve patient care. Therefore, these donors and their families deserve our highest gratitude.

Statements and Declarations

Competing Interests


The authors declare that they have no known competing financial interests or personal relationships that could have appeared to influence the work reported in this paper.


Funding statement


The authors did not receive support from any organization for the submitted work.


Ethical statement


This study was performed in line with the principles of the Declaration of Helsinki. All procedures performed in this study involving human participants were approved by the institutional review board of Fukushima Medical University (Number:1415-2).


Author contributions


Masayuki Yamada: Conceptualization, Data curation, Formal analysis, Investigation, Methodology, Project administration, Validation, Writing-original draft, Writing-review & editing. Kenichiro Iwami: Conceptualization. Masazumi Fujii: Conceptualization. Mudathir Bakhit: Formal analysis, Validation, Visualization, Writing-review & editing. Masahiro Okamoto: Formal analysis, Software. Kiyoshi Saito: Supervision.