Patient characteristics and postoperative pneumonia
Sixty-nine patients were included in this study. Among them, pathogenic bacteria were detected from at least one culture of sputum, oral swab, nasal swab, and/or pharyngeal swab obtained preoperatively in 20 patients (29%), defined as Positive. The remaining 49 patients (71%) were defined as Negative. Clinical characteristics and surgical outcomes of these two groups are summarized in Table 1. Although the Brinkman index of the positive group was marginally higher than that of the negative group (p=0.058), the background data did not differ among the two groups.
Postoperative pneumonia occurred in 22 of 69 patients (32%), with 13 of the 22 classified as having severe pneumonia (including 1 with acute respiratory distress syndrome). Postoperative pneumonia was more frequently observed in the positive group than the negative group (p=0.05), and the incidence of severe pneumonia was also higher in the positive group than the negative group (p=0.007). No significant differences were observed in age, preoperative comorbidity, respiratory function, preoperative nutritional status, location and stage of the tumor, neoadjuvant therapy, thoracic surgical approach, range of lymphadenectomy, anastomotic leakage, or recurrent laryngeal nerve palsy, between the two groups.
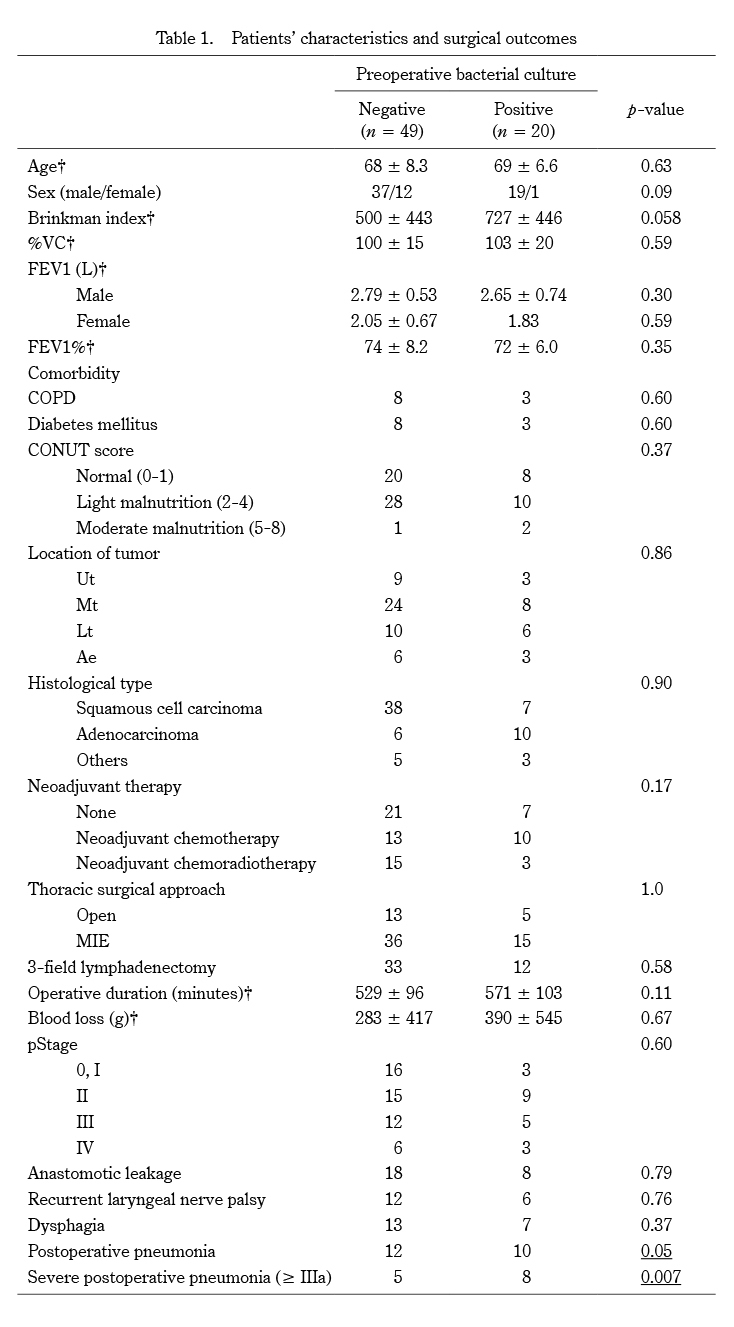
Table 1. Patients’ characteristics and surgical outcomes
†Plus-minus values are means ± standard deviation.
%VC, vital capacity as percent of predicted; FEV1, forced expiratory volume in 1 second; FEV1%, forced expiratory volume % in 1 second; COPD, chronic obstructive pulmonary disease; CONUT, controlling nutritional status; Ut, upper thoracic esophagus; Mt, middle thoracic esophagus; Lt, lower thoracic esophagus; Ae, abdominal esophagus; MIE, minimally invasive esophagectomy.
Perioperative bacterial culture
Table 2 shows the detection rate of pathogenic bacteria in preoperative cultures from each site. The positive rate was 22% in sputum culture, 18% in nasal swab culture, 5% in oral swab culture, and 11% in pharyngeal swab culture. Among patients with positive preoperative bacterial cultures, those who developed postoperative pneumonia were 5 of 10 for sputum culture, 6 of 11 for nasal swab culture, and 2 of 3 for oral swab culture. No patient positive by pharyngeal swab culture developed postoperative pneumonia.
Figure 1 shows the number of pathogenic bacterial species detected in pre- and postoperative cultures. In preoperative cultures, methicillin-susceptible Staphylococcus aureus was detected most frequently, followed by Klebsiella pneumoniae. Twenty-three bacteria were identified in postoperative cultures of sputum from the 22 patients with postoperative pneumonia. Eleven of the 22 postoperative pneumonia patients were positive for postoperative sputum culture, and in 5 of those 11 cases, pathogenic bacteria in postoperative sputum culture were identical to those in preoperative culture.
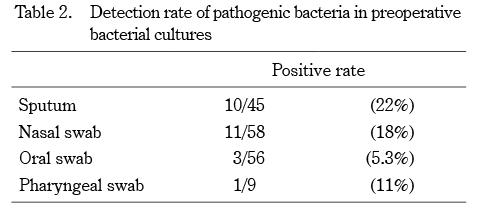
Table 2. Detection rate of pathogenic bacteria in preoperative bacterial cultures
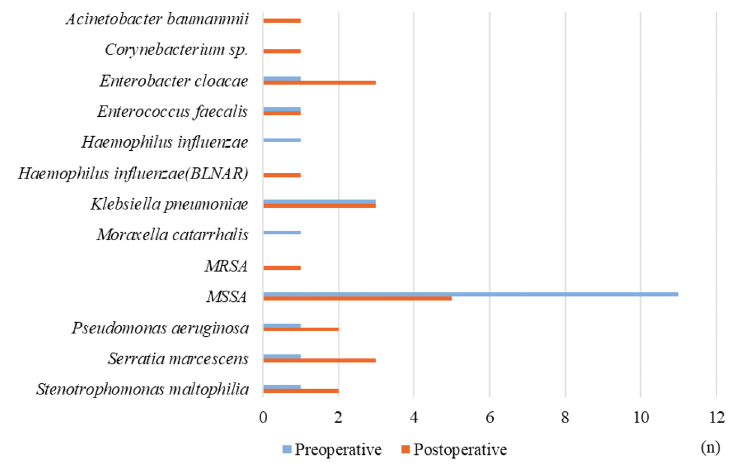
Fig. 1. Number of pathogenic bacterial species detected in pre- and postoperative bacterial cultures.
Risk factors associated with postoperative pneumonia
Table 3 shows the risk factors associated with postoperative pneumonia. By univariate analysis, postoperative pneumonia was associated with low FEV1% (p=0.018), longer operative duration (p=0.023), extensive blood loss (p=0.024), and positivity for preoperative bacterial culture (p=0.043). Multivariate analysis showed that low FEV1% (for a 10% increase;odds ratio 0.31, 95% confidence interval 0.12-0.76, p=0.011) significantly impacted the risk of postoperative pneumonia.
Table 4 shows the multivariate logistic regression analysis for risk factors of severe postoperative pneumonia. Of note, longer operative duration (for 30 minutes increase;odds ratio 1.27, 95% confidence interval 1.01-1.51, p=0.039) and positivity for preoperative bacterial test (odds ratio 5.03, 95% confidence interval 1.31-19.2, p=0.018) were significant independent risk factors for developing severe postoperative pneumonia.
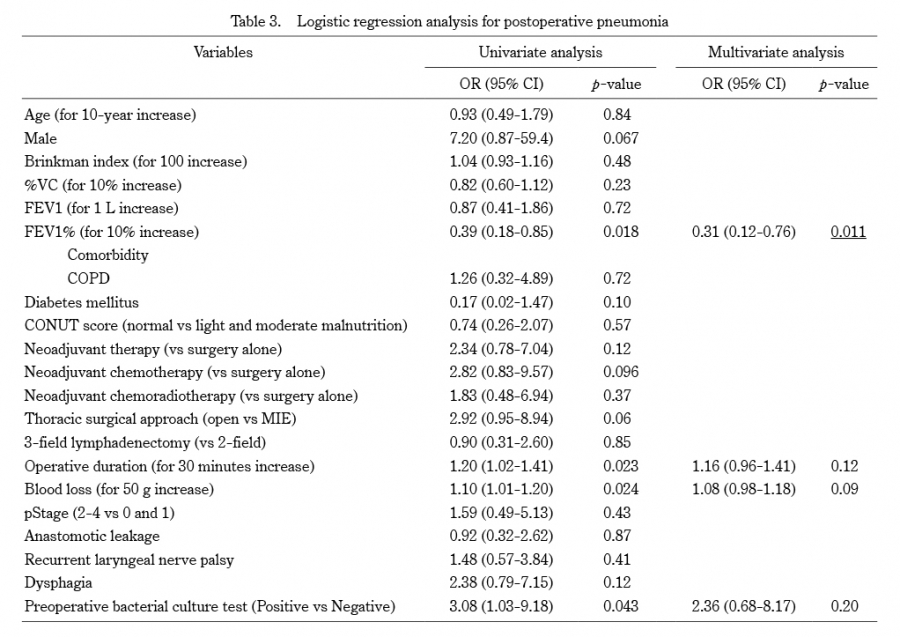
Table 3. Logistic regression analysis for postoperative pneumonia
OR, odds ratio; CI, confidence interval; %VC, vital capacity as percent of predicted; FEV1, forced expiratory volume in 1 second; FEV1%, forced expiratory volume % in 1 second; COPD, chronic obstructive pulmonary disease; CONUT, controlling nutritional status; MIE; minimally invasive esophagectomy.
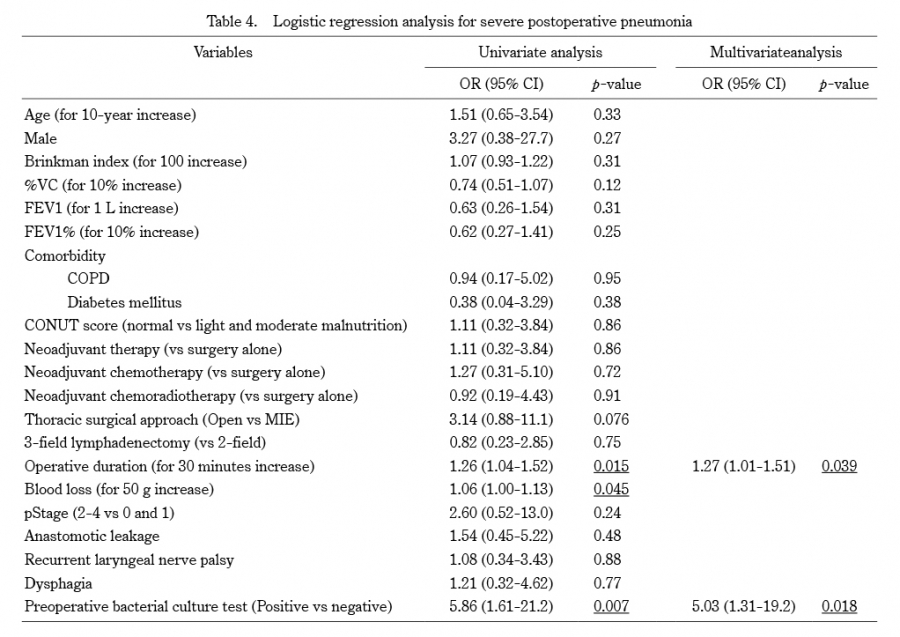
Table 4. Logistic regression analysis for severe postoperative pneumonia
OR, odds ratio; CI, confidence interval; %VC, vital capacity as percent of predicted; FEV1, forced expiratory volume in 1 second; FEV1%, forced expiratory volume % in 1 second; COPD, chronic obstructive pulmonary disease; CONUT, controlling nutritional status; MIE; minimally invasive esophagectomy.

