A 22-year-old pregnant woman sought consultation from our obstetrics department due to thrombocytopenia. Notably, her grandmother had a history of acute myeloid leukemia (AML) at a similar age. Physical examination revealed no deficiencies or limb/finger malformations, and her skin exhibited no abnormalities. Her platelet count was 5.6×10⁴/μL, accompanied by a slightly elevated immature platelet fraction (IPF) of 9.6%. Her white blood cell count was 4.9×10³/µL, comprising 68% neutrophils, 21% lymphocytes, 8% eosinophils, 1% basophils, and 2% monocytes, with no observable blast cells. Her hemoglobin (Hb) level was 12.1 g/dL, indicating a slight decrease (Table 1). The patient demonstrated a normal prothrombin time with a slight increase in activated partial thromboplastin time. Notably, lupus anticoagulants were detected in her plasma, and no anticardiolipin antibody or anti-cardiolipin-β2-glycoprotein I complex antibody was detected. The patient experienced a miscarriage due to placental insufficiency at 26 weeks of gestation. Pathological analysis attributed the miscarriage to placental infarction. Consequently, she was suspected to have antiphospholipid syndrome. Following the miscarriage, her platelet count improved to 14.0×10⁴/μL. However, when she returned three months later, her Hb concentration had decreased to 7.2 g/dL, and the platelet count was 12.9×10⁴/μL. Vitamin B12, folate, and iron deficiency were not detected, and there were no findings suggestive of hemolysis. Consequently, BM aspiration was performed to investigate the underlying cause. BM aspiration and biopsy revealed several noteworthy features: (1) erythroblasts with karyorrhexis and multinuclearity (Fig. 1A-C), (2) hyposegmented mature neutrophils and degranulated neutrophils (Fig. 1A), and (3) micromegakaryocytes and megakaryocytes with widely separated nuclei (Fig. 1D), accompanied by a low blast count (1.6% blasts). Chromosome analysis revealed a novel chromosomal translocation (46, XX, t(2;19)(p23;q13.3)) in 20 of 20 examined BM cells. The same chromosomal abnormality was also detected in 20 out of 20 peripheral lymphocytes using a commercially available laboratory test for chromosome analysis. Notably, the results of the chromosomal fragility test with mitomycin C treatment were negative. The patient’s platelet count decreased to less than 2×10⁴/μL. Her refractory anemia also progressed, with Hb levels decreasing below 5.0 g/dL. Based on these findings, the patient was diagnosed with intermediate-risk MDS (revised international prognostic scoring system score of 4.5). She required weekly red blood cell transfusions. Two months later, she developed further pancytopenia, and a subsequent BM examination revealed progressive marrow fibrosis (Fig. 1E). Additionally, splenomegaly was detected on the computed tomography scan obtained at that time. No erythroblasts, megakaryocytes, or myeloblasts were observed in the peripheral blood. Due to the patient’s young age and the idiopathic nature of the BMF, HSCT was deemed necessary for a potential cure. However, donor matching took considerable time because the patient had a broad range and high levels of donor-specific anti-human leukocyte antigen (HLA) antibodies. One year and six months later, she underwent CBT from an HLA-DR 1 allele mismatched unrelated male donor. The conditioning regimens included fludarabine (180 mg/m²), melphalan (80 mg/m²), and total body irradiation (3.3 Gy). Prophylaxis for graft versus host disease (GVHD) included tacrolimus and mycophenolate mofetil. The graft was infused on Day 0, containing 2.27 × 10⁷ cells/kg (CD34+ cells; 0.56 × 10⁵/kg). Neutrophil engraftment was confirmed on Day 36. Chimerism analysis revealed 99.8% of cells with the donor’s normal male karyotype. However, thrombocytopenia with elevated IPF persisted. The patient was administered prednisolone (0.5 mg/kg/day) starting on Day 45, followed by eltrombopag olamine (EPAG) (12.5 mg/day) beginning on Day 62, in response to a diagnosis of immune thrombocytopenia. The patient’s platelet count recovered to 20 × 104/μL by Day 76. She did not develop ≥Grade 2 GVHD (Fig. 2A). Currently, more than a year has passed since transplantation, and her blood count has normalized with EPAG treatment.
To identify the breakpoint of this rare translocation, we conducted RNA-seq analysis on BM mononuclear cells before CBT. Total RNA was extracted from BM mononuclear cells using a NucleoSpin RNA Plus kit (TaKaRa, Shiga, Japan). Library preparation was performed using the library using a TruSeq stranded mRNA Library kit (Illumina, San Diego, USA). RNA-seq was performed using the Illumina NovaSeq 6000 platform with paired-end 100 bp reads. A total of 5,276,743,182 reads were generated, with 95% passing the quality filter. The mean Q30 score was 93.2%, indicating high read quality. The total read count for raw data was 52.24. The obtained FASTQ files were trimmed using Trimmomatic (v0.39). Mapping to the reference genome and fusion gene detection were subsequently conducted using STAR-Fusion (v1.11.0). These results revealed the translocation breakpoints on the chromosomes, resulting in the disruption of the DPY30 (Ensembl gene ID ENSG00000162961) and CEACAM6 (Ensembl gene ID ENSG00000086548) genes (Fig. 2B). The junction read count for the DPY30-CEACAM6 was 12. We visualized the waveform data using Unipro UGENE7), confirming the cleavage points of the DPY30 and CEACAM6 genes detected by Sanger sequencing (Fig. 2C). This fusion gene is unable to code for a protein due to the presence of a stop codon in the middle (Fig. 2D).
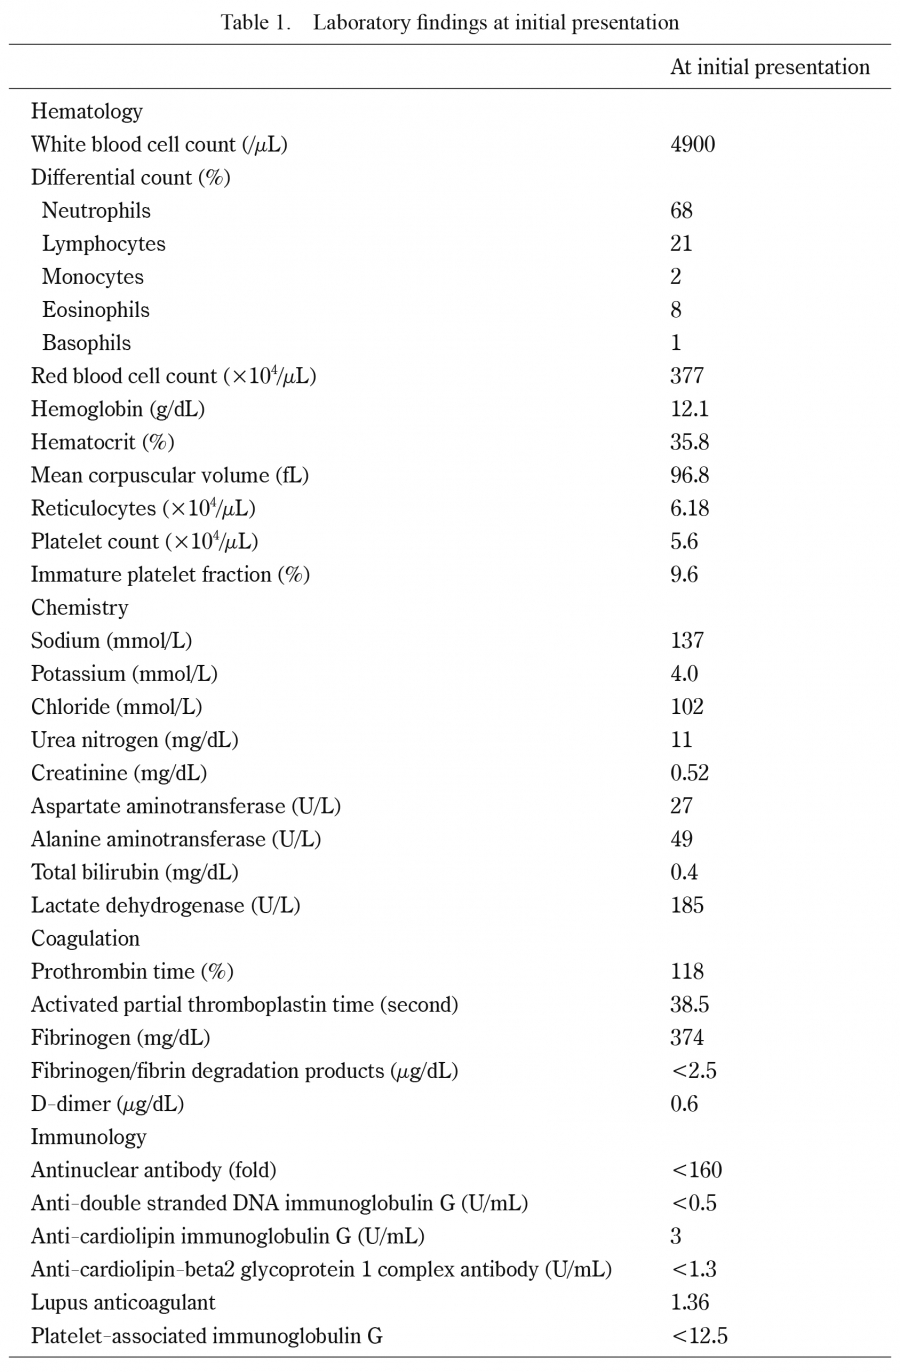
Table 1.
Laboratory findings at initial presentation
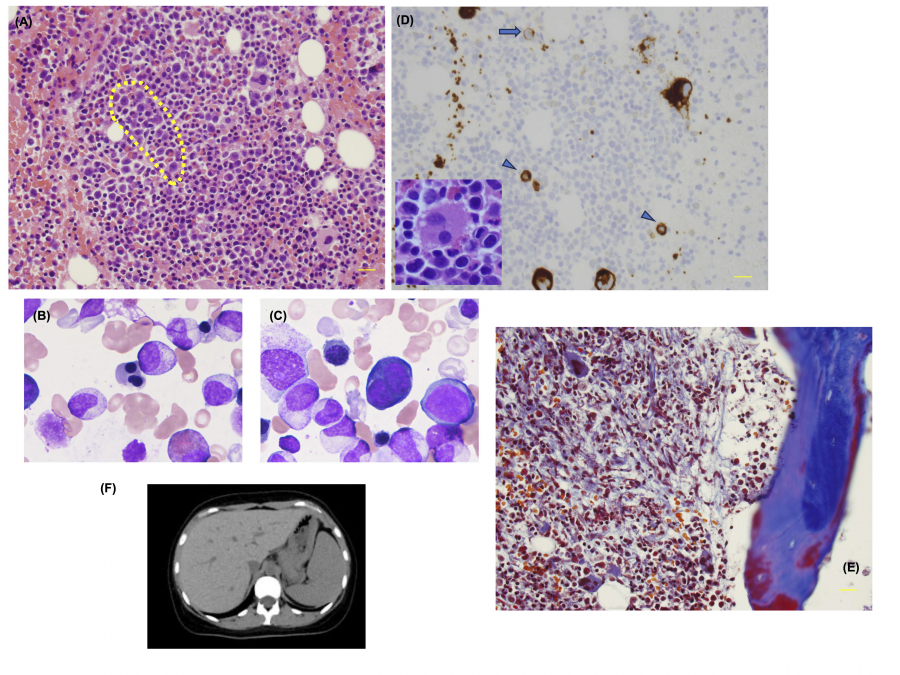
Fig. 1.
Pathological and morphological analysis of a bone marrow (BM) biopsy specimen from the patient.
(A) Under a 40x objective, the hematoxylin and eosin (HE)-stained specimen exhibits erythroblasts with megaloblastic changes (indicated by the yellow dotted line). Hyposegmented mature neutrophils are also prominent. The BM smear shows multinucleated polychromatic erythroblasts (B) and basophilic erythroblasts (C). (D) CD42b staining reveals micromegakaryocytes (arrowheads) and megakaryoblasts (arrows). The enlarged inset shows a megakaryocyte with multiple widely separated nuclei. (E) Masson’s trichrome staining demonstrates the progression of BM fibrosis, with a significant increase in collagen fibers compared to those at the initial examination. (F) Computed tomography image shows mild hepatosplenomegaly during the disease course.
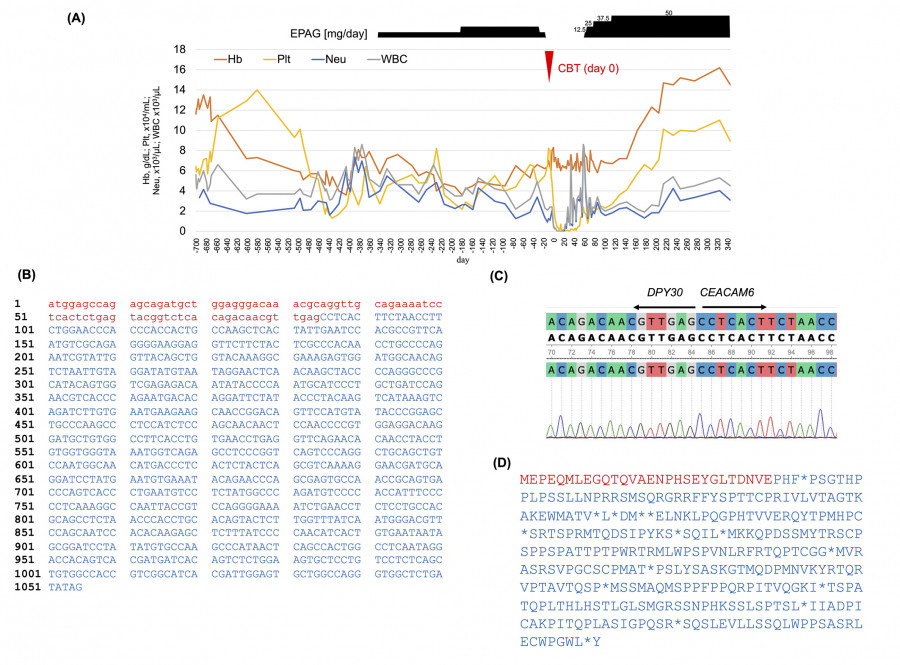
Fig. 2.
Destruction of the DPY30and CEACAM6genes by t(2;19)(p23;q13.3) translocation.
(A) Day 0 of the clinical course is set as the day of umbilical cord blood transplantation. (B) Predictions of chromosomal translocations detected by STAR-Fusion (v1.11.0) reveal coding effects. Red lowercase letters represent DNA sequences from the DPY30 gene, while blue uppercase letters correspond to sequences from the CEACAM6 gene. (C) Waveform data visualized using Unipro UGENE confirm the cleavage points of the DPY30 and CEACAM6 genes detected by Sanger sequencing. (D) Predicted amino acid sequences are shown by STAR-Fusion (v1.11.0).

