1) Comparison of baseline characteristics between the three groups
The age of onset and duration of follow-up from the initial therapy were 9.0 ± 2.0 and 8.6 ± 2.2 years, respectively, in group 1, 12.4 ± 0.4 and 9.1 ± 1.7 years in group 2 and 14.7 ± 0.4 and 9.3 ± 1.7 years in group 3. The male-to-female ratios were 17:7 and 3:6 and 8:3 in group 1, group 2 and group 3, respectively. Duration from onset to renal biopsy and duration from the first renal biopsy to the second biopsy were 4.4 ± 3.7 and 24.9 ± 2.5 months, respectively, in group 1, 6.7 ± 4.7 and 23.9 ± 2.8 months in group 2, and 4.9 ± 3.9 and 25.8 ± 2.0 months in group 3 (Table 1).
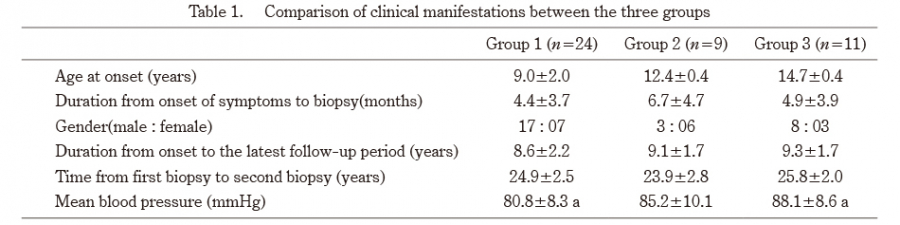
Table 1. Comparison of clinical manifestations between the three groups
a p<0.01, b p<0.05
The mean blood pressure in group 3 was higher than that in group 1.
2) Comparison of laboratory findings at the time of the first and second renal biopsies, and at the most recent follow up between the three groups
At the time of the first renal biopsy, the serum IgA value in group 3 was higher than that of group 1, while the eGFR values did not differ between the three groups (Figure 1). At the time of the second renal biopsy and at the most recent follow up, the serum IgA value in group 3 was higher than those of groups 1 and 2, while the eGFR value in group 3 was lower than those of groups 1 and 2.
At the most recent follow up, the urinary protein excretion, incidences of hematuria, and serum IgA values in group 3 were higher than those of group 1 and group 2. The eGFR value in group 3 was lower than those of groups 1 and 2.
With regard to the serum IgA values, the serum IgA values of group 1 and group 2 at the time of the second renal biopsy were lower than those at the time of the first renal biopsy (p<0.05, p<0.05, respectively) and the serum IgA values in group 3 did not differ between the first and second renal biopsy. The serum IgA values in group 1 and group 2 at the most recent follow up were lower than those at the time of the first biopsy, and the serum IgA values in group 3 did not differ between the values from the most recent follow up and the first biopsy.
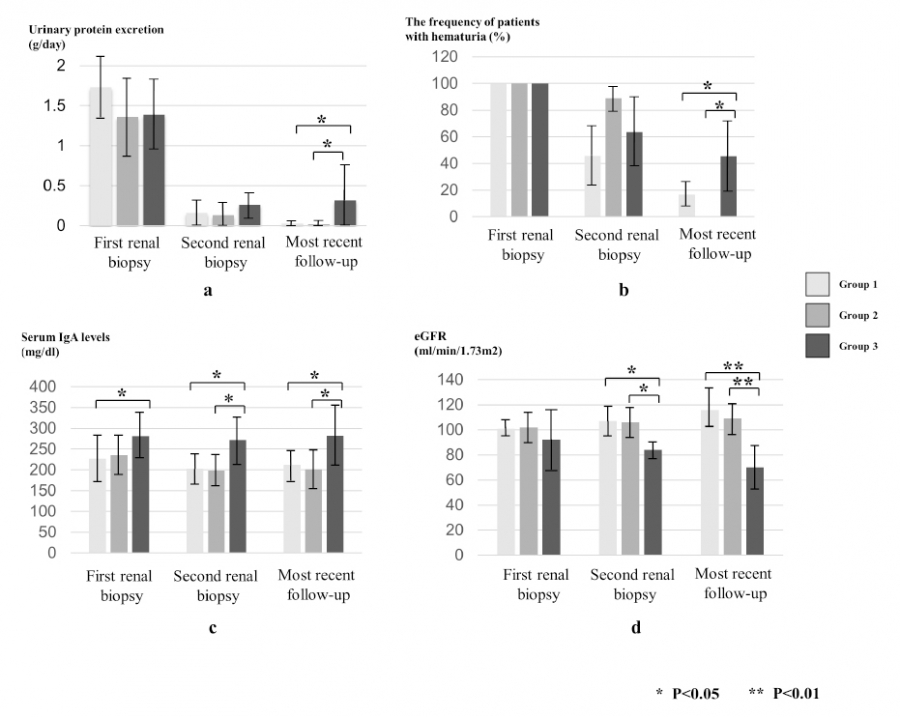
Fig. 1.
Comparison of urinary protein excretion (a), frequency of patients with hematuria (b), serum IgA levels (c), and eGFR (d) between three patient groups at the time of first biopsy, second biopsy and at the most recent follow-up.
3) Comparison of the pathological findings at the first and second renal biopsy between the three groups
The IF findings revealed that amounts of IgA, C3 and fibrinogen in the glomeruli at the time of the second renal biopsy were lower than those at the time of the first renal biopsy (p<005) in each group. At the time of the first renal biopsy, the amount of glomerular C3 in group 3 was higher than that in group 2 (p<0.05), and at the time of the second renal biopsy, the amount of glomerular C3 in group 3 was higher than that in group 2 (p<0.05) (Table 2).
Histological analyses according to the Oxford classification criteria showed the ratios of M0M1, E0E1, S0S1, T0T1T2, absence/presence of crescents and MESTCG scores at the time of the second biopsy were lower than those at the time of the first biopsy in each group. At the time of the second biopsy, MESTCG scores, the percentage of glomeruli showing crescents and glomerulosclerosis in group 3 were higher than those in group 1, but there were no significant differences in the ratios of M0M1, E0E1, S0S1, T0T1T2, absence/presence of crescents, global sclerosis, and MESTCG scores at the time of the first and second biopsy between group 1 and group 2 (Table 3).
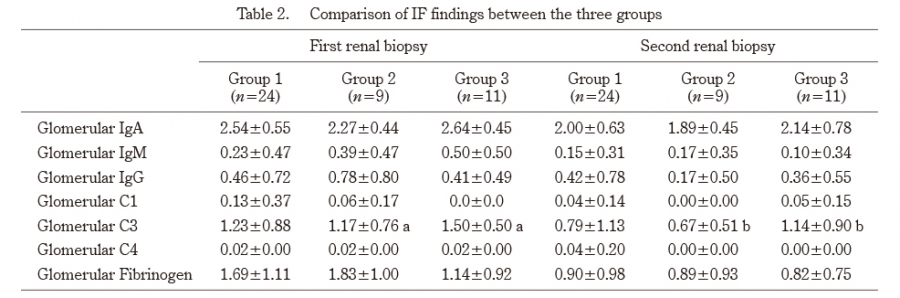
Table 2. Comparison of IF findings between the three groups
a, b p<0.05
At the time of the first renal biopsy, the amount of C3 in group 3 was higher than that in group 2 (p<0.05), and at the time of the second renal biopsy, the amount of C3 in group 3 was higher than that in group 2 (p<0.05).
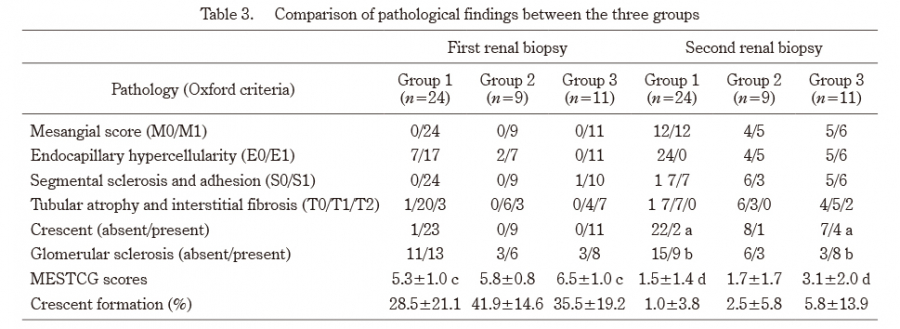
Table 3. Comparison of pathological findings between the three groups
a,b,c,d p<0.05
At the time of the second biopsy, MESTCG scores, the percentage of glomeruli showing crescents and glomerulosclerosis in group 3 were higher than those in group 1.
4) Comparison of clinical stage at the most recent follow-up and side effects between the three groups
At the most recent follow up, 23 patients (95.8%) in group 1, 9 (100%) in group 2, and 7 (63.6%) in group 3 had normal urine or minor urinary abnormalities, while one patient (4.2%) in group 1, none in group 2 and 4 (36.3%) in group 3 had persistent nephropathy or renal insufficiency. The incidence of patients with persistent nephropathy or renal insufficiency in group 3 was higher than those in group 1 and group 2 (Table 4).
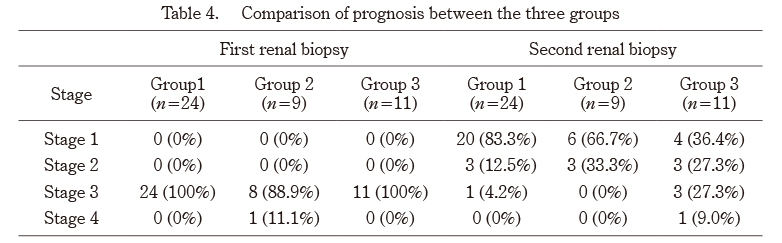
Table 4. Comparison of prognosis between the three groups
The incidence of patients with persistent nephropathy or renal insufficiency in group 3 was higher than those in group 1 and group 2 (p<0.05).

