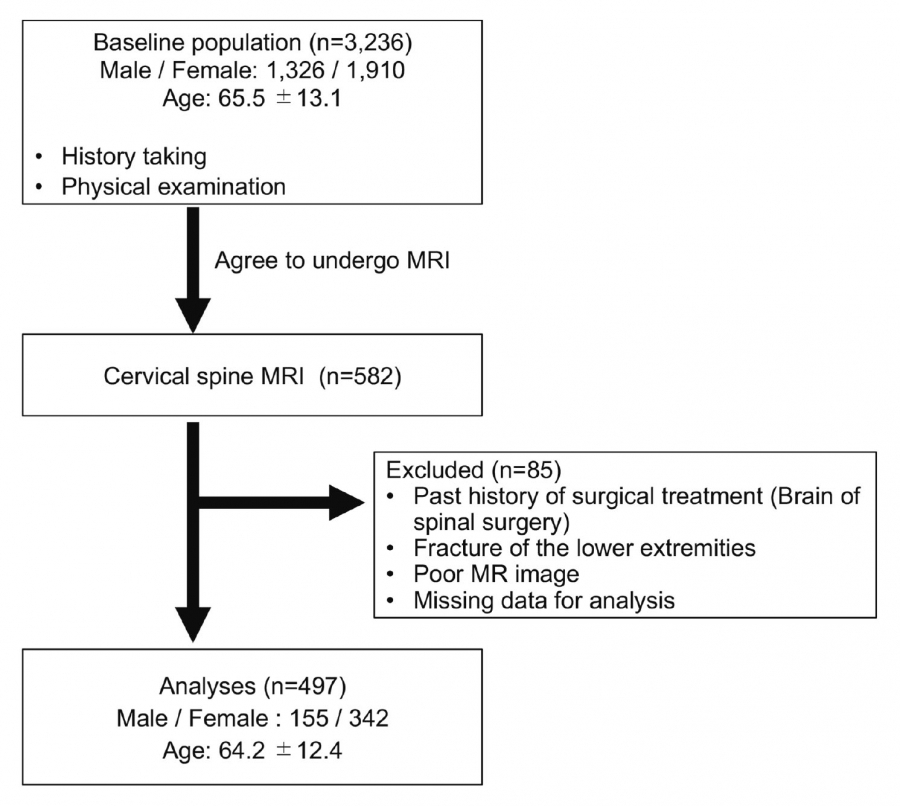
This was a cross-sectional study based on epidemiologic data from public health screening conducted in 2005 by local governments in Tadami Town, Ina Village, and Tateiwa Village of Fukushima Prefecture, Japan9). From 3,236 participants (1,326 men, 1,910 women; age range 19-94 years; average age, 65.5 years), a total of 582 agreed to undergo MRI of the cervical spine and answered a questionnaire about the presence of neck pain or shoulder stiffness. They were asked “Do you have neck pain which needs medical care?” and “Do you have shoulder stiffness which needs medical care?” separately. Neck symptoms included those with either neck pain or shoulder stiffness. The exclusion criteria were if they were unable to walk independently or fill out questionnaires due to visual impairment, or had ever undergone brain or spinal surgery. Cases with MRI results insufficient for all classification systems, and those with missing questionnaire data, were excluded.
Municipality-based public health screening is part of Japan’s system of universal health care. Participation is voluntary. This supplemental study was approved by the ethics committee of Fukushima Medical University (No.1880). Informed consent was documented in writing for all study participants.
MRI assessment
Disc degeneration, Modic change, and Schmorl’s nodes were evaluated on MRI images. The detailed imaging conditions of the MRI scanners are shown in the supplemental data.
Disc degeneration was assessed using five classifications: Matsumoto’s grading system8), Miyazaki’s grading system4), Nakashima’s grading system7), Jacobs’ grading system1), and Suzuki’s grading system5). A midsagittal T2-weighted image (WI) was obtained at each level of the intervertebral discs from C2 to Th1. Matsumoto’s grading system consists of four parts: disc degeneration, posterior disc protrusion, anterior disc protrusion, and narrowing of the disc space. Grades 0 to 2 were chosen using the criteria shown in Table 1. Miyazaki’s grading system evaluates disc degeneration by nucleus signal intensity, nucleus structure, distinction between the nucleus and annulus, and disc height4). Grades 1 to 5 were chosen using the criteria shown in Table 1. Nakashima’s grading system evaluates disc degeneration by nucleus structure, the border of the nucleus, and disc height with a flow chart (Fig. 1)7). Jacobs’ grading system uses nucleus signal intensity and disc height1). The grades are grade 0 (normal disc height, with or without a cleft in the nucleus pulposus), grade 1 (dark disc, with normal height), grade 2 (collapsed disc, little or no osteophytes), and grade 3 (collapsed disc, with many osteophytes) (Table 1). Suzuki’s grading system uses disc height, nucleus signal intensity, the border of the nucleus, and disc bulge with a flow chart (Fig. 2)5,10). Disc degeneration of the entire cervical spine was assessed using the degenerative disc disease (DDD) score, which is the sum of the grades at each cervical disc level (C2/3-C7/T1) in each of the five classifications11).
To evaluate the intra/inter-observer reliabilities of each classification, a sample size calculation was estimated for ρ = 0.8 with a 95% confidence interval of 0.4, rated by two examiners; at least 20 subjects would be needed. Therefore, 30 subjects were randomly selected for kappa analysis. Each intervertebral level from C2/3 to C7/T1 was measured by two orthopedic surgeons (HO & TW). The five classifications of disc degeneration were measured four times each in each subject. The second and third measurements were performed one week and one month after the first measurement. The fourth measurement was performed one week after the third assessment. Finally, one orthopedic surgeon (HO) examined all images without any participants’ information, including their symptoms. Other MRI assessments of vertebral endplate changes for Modic changes and Schmorl’s nodes were examined. Modic changes were scored type I (hypointense on T1-WI and hyperintense on T2-WI), type II (hyperintense on T1- and T2-WI), and type III (hypointense on T1- and T2-WI) (Table 1)12). Schmorl’s nodes were defined as more than a 2-mm deficit on T2-WI at each vertebral body level. The presence of a Schmorl’s node was defined as observation of a node at least one vertebral endplate level13).
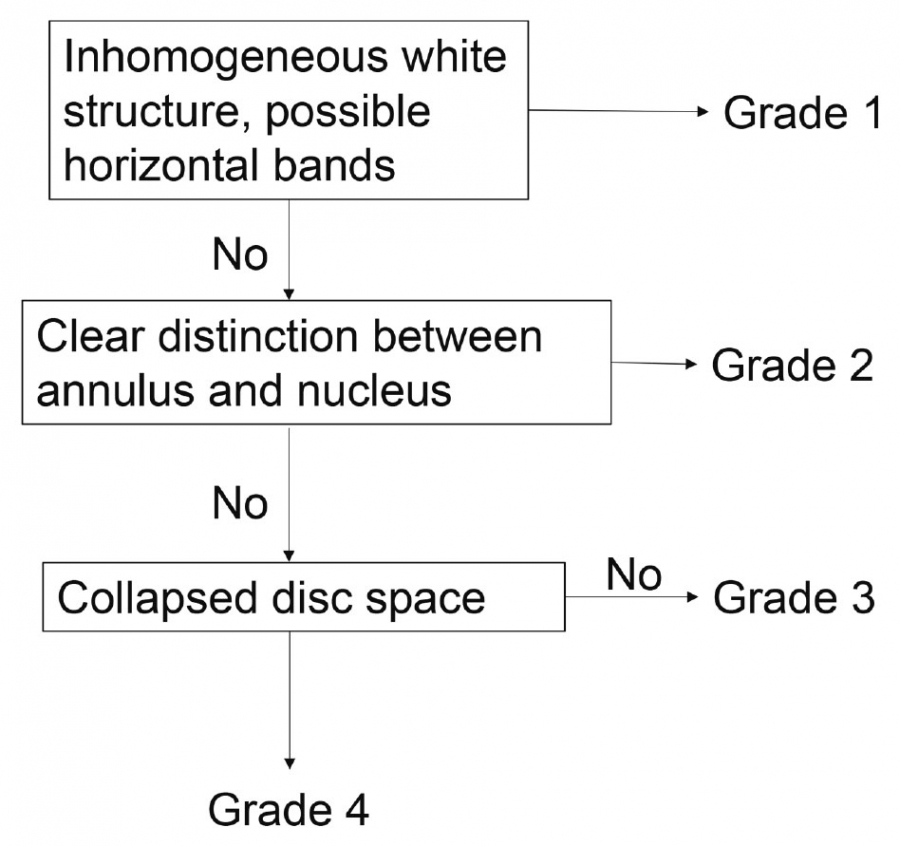
Fig. 1. Algorithm for Nakashima’s classification7)
Nakashima’s classification evaluates disc degeneration in the order of nucleus structure, border of the nucleus, and disc height. If nucleus structure is inhomogeneously white, it is Grade 1. If the border of the nucleus is clear, it is Grade 2. If the disc is collapsed, it is Grade 4.
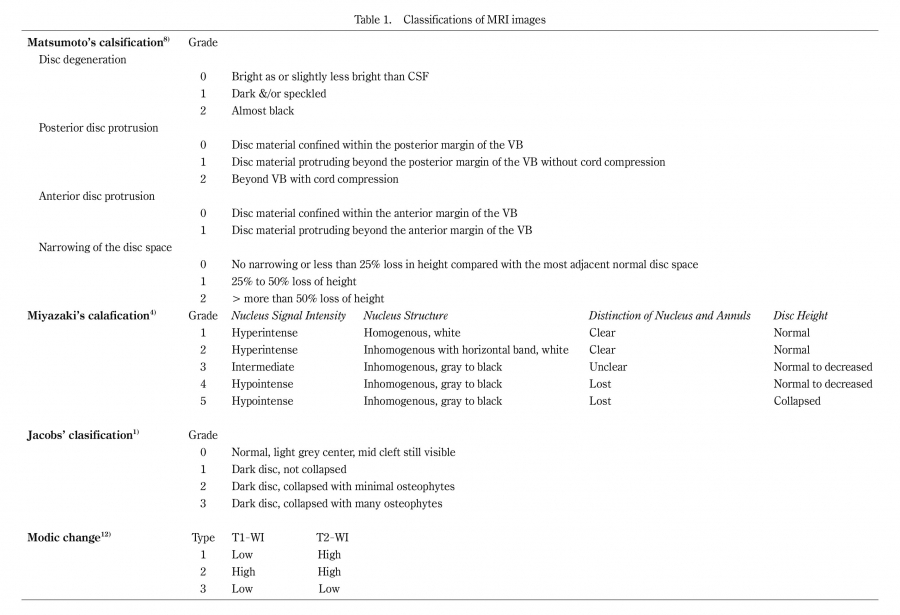
Table 1. Classifications of MRI images
Abbreviations: CSF, cerebrospinal fluid; VB, vertebral body; WI, weighted image
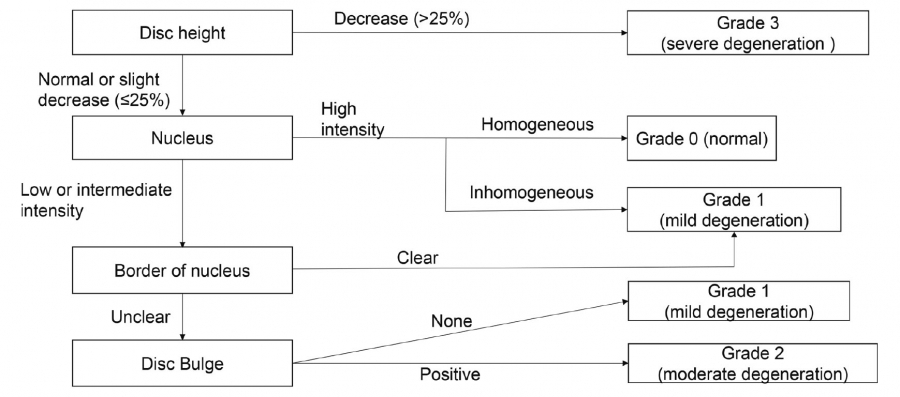
Fig. 2. Algorithm for Suzuki’s classification5)
Suzuki’s classification evaluates disc degeneration in the order of disc height, nucleus signal intensity, border of the nucleus, and disc bulge. If the disc height decreases by more than 25%, it is grade 3. If the nucleus is high intensity and homogeneous, it is grade 0. If the nucleus is high intensity and inhomogeneous, or if the border of the nucleus is clear, it is grade 1. If the border is not clear, but it does not have disc bulge, it is also grade 1. If the border is not clear, and it has disc bulge, it is grade 2.
Data analysis
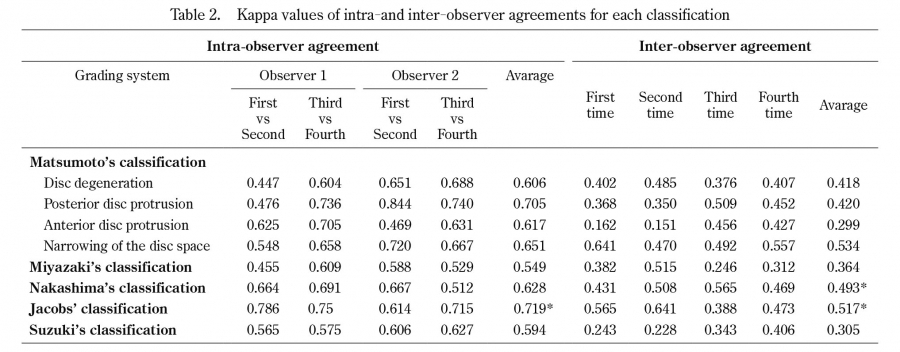
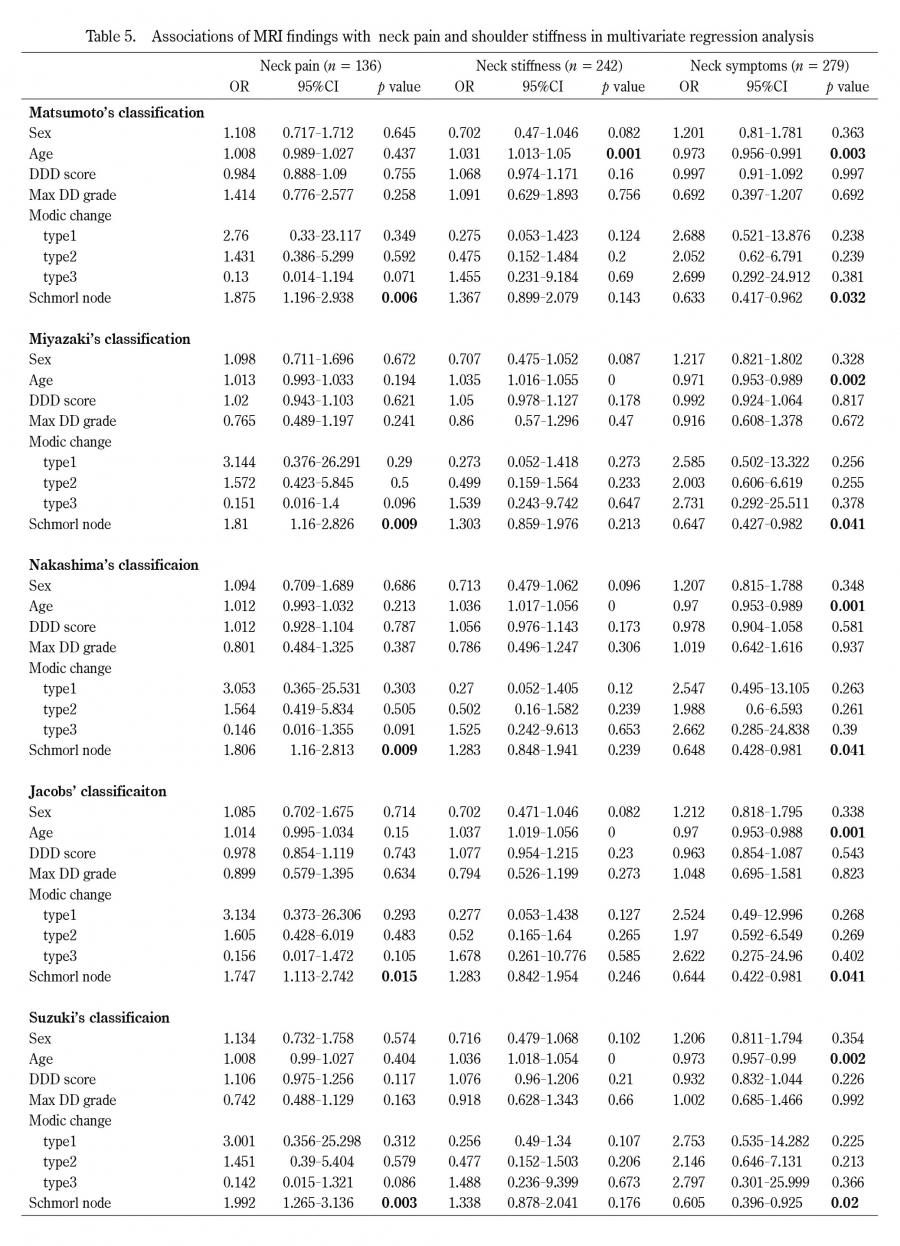
Intra-observer and inter-observer agreements were assessed by κ values for each classification. First, the κ values of intra-observer agreement were calculated between the first and second measurement results of each intervertebral disc level by two observers. Second, the κ values were calculated between the third and fourth measurements in the same way. Finally, the average of these four κ values was used to evaluate intra-observer reliability. The inter-observer agreement was calculated between the first measurement results of each observer. Similarly, the κ values of the second to fourth measurements were calculated. The average of these four κ values was used to evaluate inter-observer reliability. Interpretations were performed in accordance with the guidelines suggested by Landis and Koch14). Agreement was rated as follows: poor, κ 0 to 0.2; fair, κ 0.21 to 0.4; moderate, κ 0.41 to 0.60; substantial, κ 0.61 to 0.8; and excellent, κ > 0.81. A value of 1 indicated absolute agreement, whereas a value of 0 indicated agreement no better than chance. In addition, comparison between groups was performed using Tukey’s test and the Games-Howell test. A p value of less than 0.05 was considered significant. Odds ratios (ORs) were estimated using a logistic regression model, and a two-sided p < 0.05 was considered significant. ORs were adjusted for age, sex, and other explanatory variables to evaluate associations between the presence of neck pain, neck stiffness, or neck symptoms (either neck pain or shoulder stiffness) and the findings of MRI images. Baseline characteristics are described using appropriate summary statistics with the chi-squared test, Mann-Whitney U test, and Cochran-Armitage’s propensity test. Statistical analyses were performed using SPSS (version 13, SPSS, Chicago, IL). A p value of less than 0.05 was considered significant.