The cintent of reseach paper

Secular changes in bone mineral density of adult Japanese women from 1995 to 2013

Hiroaki Watanabe, Yasuko Minagawa, Ichiro Suzuki, Kaori Kitamura, Yumi Watanabe, Keiko Kabasawa, Kseniia Platonova, Aya Hinata, Kazutoshi Nakamura, Kazutoshi Nakamura

Author information
  • Hiroaki Watanabe

    Department of Preventive Medicine, Niigata University Graduate School of Medical and Dental Sciences
    Department of Clinical Engineering and Medical Technology, Niigata University of Health and Welfare

  • Yasuko Minagawa

    Shibata Comprehensive Health Care Service Center

  • Ichiro Suzuki

    Shibata Comprehensive Health Care Service Center

  • Kaori Kitamura

    Department of Preventive Medicine, Niigata University Graduate School of Medical and Dental Sciences

  • Yumi Watanabe

    Department of Preventive Medicine, Niigata University Graduate School of Medical and Dental Sciences

  • Keiko Kabasawa

    Department of Health Promotion Medicine, Niigata University Graduate School of Medical and Dental Sciences

  • Kseniia Platonova

    Department of Preventive Medicine, Niigata University Graduate School of Medical and Dental Sciences

  • Aya Hinata

    Department of Preventive Medicine, Niigata University Graduate School of Medical and Dental Sciences

  • Kazutoshi Nakamura

    Department of Preventive Medicine, Niigata University Graduate School of Medical and Dental Sciences

  • Kazutoshi Nakamura

    Department of Preventive Medicine, Niigata University Graduate School of Medical and Dental Sciences

Introduction

Osteoporosis is a skeletal disorder involving compromised bone strength which predisposes individuals to an increased risk of fracture1). The burden of osteoporosis and osteoporotic fracture is enormous. The global number of hip fractures in 2010 was estimated to be 2.7 million2). In Japan, there were an estimated 175,700 hip fractures in 20123), representing an increase over the last few decades3,4). This increase may partly be explained by aging of the population. While hip fracture incidence rates in European and North American countries generally stabilized with age-adjusted decreases in the last few decades5,6), one review5) reported that the incidence rate rose in Asia, and Japan was not an exception. Orimo et al.3) reported that hip fracture incidence rates in Japan for people in their 80’s and 90’s increased from 1992 to 2012, and Miyasaka et al.4) similarly reported that age-adjusted incidence rates increased from 1985 to 2010 in Niigata, Japan.


The reasons underlying the long-term increase in hip fracture incidence in Japan are unclear, but may be related to an increased prevalence of osteoporosis, generally diagnosed based on bone mineral density (BMD)1). One question that arises is whether BMD of community-dwelling people changes over time in the long term. While some have reported a secular change in BMD, others have reported conflicting results. For instance, Xu and Wu reported a decreasing trend of BMD in a US population of the National Health and Nutrition Examination Survey (NHANES) 2005-20147), whereas Cheung et al.8) reported an increasing trend of BMD in Hong Kong women. Thus, further studies on secular changes in BMD in a general population are needed.


Female sex is a risk factor for low BMD due not only to biological factors but also to behavioral ones. For instance, dieting to lose weight is a typical, female-related risk factor. According to previous studies, nearly half of adult females had a history of dieting in Japan9) and worldwide10). The National Health and Nutrition Survey in Japan reported that total energy intake (men and women combined) showed a decreasing trend from 2,088 kcal/day in 1985 to 1,897 kcal/day in 2017, and that the proportion of underweight (body mass index [BMI] <18.5 kg/m2) women showed an increasing trend from 8.1% in 1985 to 10.3% in 201711). These data suggest that BMD of Japanese women is likely decreasing.


This study aimed to determine whether BMD of Japanese women decreased in the long term, while also considering BMI changes. To this end, we analyzed a large dataset of BMD measurements from a health check-up program for community-dwelling people between 1995 and 2013.

Subjects and methods

Subjects


We targeted 12,799 women, aged between 20 and 79 years, who underwent BMD measurement as part of a health check-up examination at Shibata Comprehensive Health Care Service Center (Niigata, Japan) between 1995 and 2013, when BMD measurements using the DTX-200 osteometer were terminated. All women whose BMD was measured during this period were eligible for inclusion in this study. However, women who did not have concomitant measurements of BMI (an important determinant of BMD) were excluded. For statistical analysis, we used only data from the first BMD measurement for those who underwent two or more BMD measurements during the study period. Of the 12,799 women, 10,649 were analyzed after excluding 2,150 who had missing BMI data. Men were not included in the analysis given the limited number of men with BMD measurements (n=2,250) relative to women. This study used data obtained from an anonymized database of Shibata Comprehensive Health Care Service Center. The protocol of this study was approved by the Ethics Committee of Niigata University (No. 2017-0396).


Measurements


BMD of the distal, non-dominant forearm was measured with the dual-energy X-ray absorptiometry (DXA) method using the DTX-200 osteometer (Osteometer MediTech A/S, Rødovre, Denmark). The DTX-200 system automatically scans 24 mm of the radius and the ulna, proximal from the point with an 8 mm radius-ulna gap. Details regarding BMD measurements have been described previously12). The Shibata Comprehensive Health Care Service Center had checked the intra-coefficient of variation (CV) of DTX-200 measurements using a standard phantom every morning during health check-up examinations throughout the study period and confirmed that values were within ±2.0%. The long-term CV of the Shibata Comprehensive Health Care Service Center is reported to be 0.8%13). Age, sex, weight, and height were obtained from health check-up records. BMI was calculated as weight (kg) divided by the square of height (m2).


Statistical analysis


Mean and standard deviation (SD) were calculated to characterize BMD and BMI by year. Mean BMDs by age group and year were then subjected to a trend test using simple linear regression analysis. The statistical significance of secular changes in BMD from 1995 to 2013 was tested with simple and multiple linear regression analyses using the following models: 1) unadjusted, 2) age-adjusted, and 3) age- and BMI-adjusted models. In addition, we conducted the same analysis for secular changes from 1995 to 2008 as a sensitivity analysis. From 2009, the local government canceled subsidies for BMD measurements, and thus the number of subjects with BMD measurements from 2009 onward steeply decreased. Under these circumstances, subjects might have had more interest in their bone health after 2009 compared to before 2009 (i.e., potential self-selection bias). Statistical analyses were conducted with the SAS statistical package (release 9.4, SAS Institute Inc., Cary, NC, USA). P<0.05 was considered statistically significant.

Results

Table 1 shows age, BMI, and BMD by year. The number of subjects was the largest in the first year of the study period (1995), and decreased gradually thereafter. The number of subjects in 2009 sharply decreased from the number in 2008 (a decrease of 60.6%). Mean BMIs were 20.4 (SD, 2.6, N=430), 21.1 (SD, 2.9, N=1,197), 21.9 (SD, 3.0, N=2,257), 22.7 (SD, 3.1, N=3,342), 22.9 (SD, 3.0, N=3,048), and 23.1 kg/m2 (SD, 3.0, N=375) for women in their 20’s, 30’s, 40’s, 50’s, 60’s, and 70’s, respectively.


Table 2 shows secular changes in mean BMD by age group, with a graphical representation presented in Figure 1. Data for subjects in their 20’s and 70’s are not included given the small sample size. BMDs of subjects in their 40’s (P for trend=0.0054) and 70’s (P for trend=0.0225) decreased significantly from 1995 to 2013.


Secular changes in BMD from 1995 to 2013 by age group were examined by regression coefficients (β) in linear regression analyses (Table 3). The BMD of subjects in their 40’s decreased significantly in unadjusted (P for trend=0.0054) and age-adjusted (P for trend=0.0162) models, but not in the age- and BMI-adjusted model (P for trend=0.2171). The BMD of subjects in their 50’s decreased marginally in the age-adjusted model (P for trend=0.0535), but not in the age- and BMI-adjusted model (P for trend=0.6601).


Secular changes in BMD from 1995 to 2008 by age group are also shown in Table 3. The BMD of subjects in their 40’s decreased significantly in unadjusted (P for trend=0.0161) and age-adjusted models (P for trend=0.0445), but not in the age- and BMI-adjusted model (P for trend=0.4186). The BMD of subjects in their 50’s decreased significantly in the age-adjusted model (P for trend=0.0090), but not in the age- and BMI-adjusted model (P for trend=0.4648). Significant changes in BMD were not observed for subjects in their 30’s or 60’s.


Secular changes in mean BMI from 1995 to 2013 by age group are shown in Figure 2. A simple linear regression analysis showed that BMI decreased significantly for subjects in their 40’s (β=−0.050, P for trend=0.0002), 50’s (β=−0.076, P for trend<0.0001), and 60’s (β=−0.042, P for trend<0.0001). Significant changes in BMI were not observed for subjects in their 30’s (β=0.027, P=0.2399).


Table 1. Subject age, body mass index (BMI), and forarm bone mineral density (BMD) by year


Table 2. Forearm bone mineral density of women by age group and year


Fig. 1. Secular trends in mean forearm bone mineral density (BMD) by age group. Results of statistical tests are presented inTable 3. The number of subjects with BMD measurements from 2009 onward steeply decreased.


Table 3. Regression coefficients (β) of year for forearm bone mineral density as an outcome variable calculated by simple and multiple linear regression analyses between 1995 and 2013


Fig. 2. Secular trends in mean body mass index (BMI) by age group.

BMI decreased significantly in subjects in their 40’s (β=−0.050,P=0.0002), 50’s (β=−0.076,Pfor trend<0.0001), and 60’s (β=−0.042,Pfor trend<0.0001), but not in subjects in their 30’s (β=0.027,Pfor trend=0.2399). The number of subjects with BMD measurements from 2009 onward steeply decreased.


Discussion

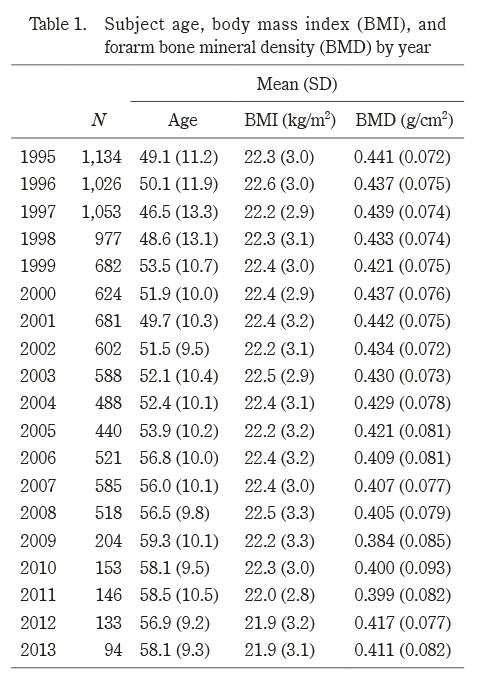
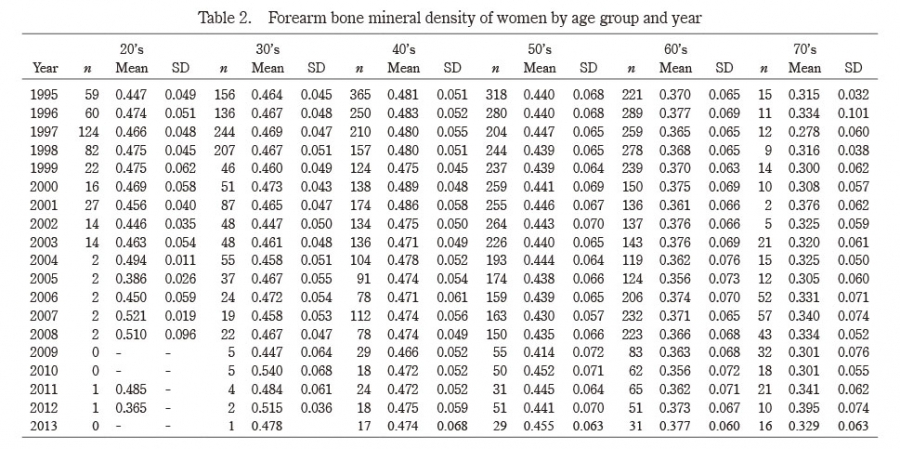
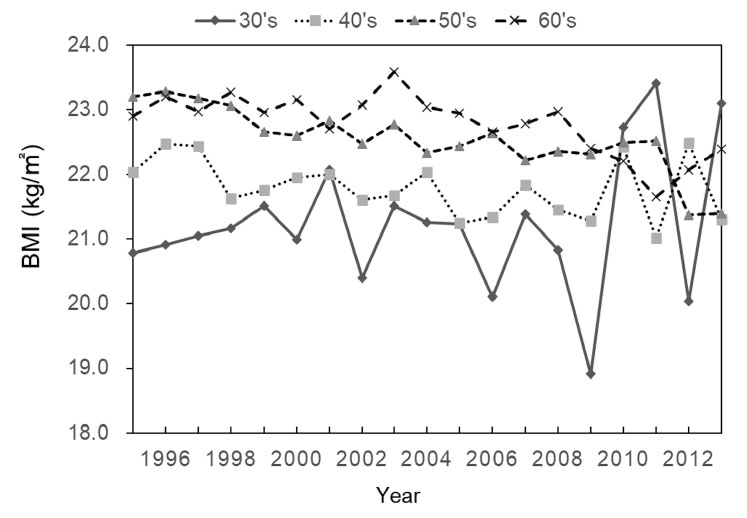
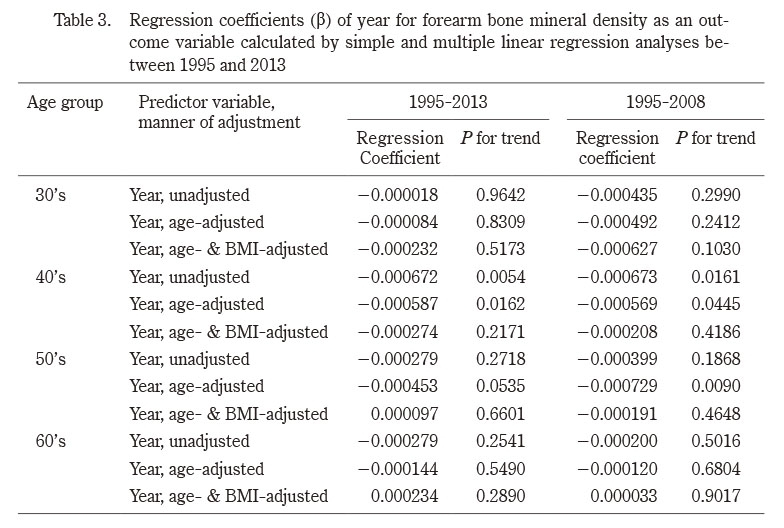
 The present study investigated secular changes in forearm BMD and BMI of adult Japanese women from 1995 to 2013, with the following findings: 1) age-adjusted BMD of subjects in their 40’s and 50’s decreased, 2) their age- and BMI-adjusted BMD did not decrease, and 3) BMI of subjects in their 40’s, 50’s, and 60’s decreased.


 Only a few studies have reported on secular changes in BMD. Xu and Wu7) studied hip BMD in US subjects (age ≥30 years [mean age, 53 years]) who participated in the NHANES from 2005 to 2014, and found that their BMD decreased during that period, particularly between 2009 and 2014. The authors suggested that this decrease in BMD corresponded to an increased trend of hip fracture in women aged ≥65 years between 2012 and 20156), and that BMD is a strong predictor of hip fracture7). While our findings are consistent with this previous report7), our study has the advantage of having conducted age-stratified analyses of BMD changes. Contrary to the results of Xu and Wu’s study7) and ours, Cheung et al.8) reported an increase in hip BMD in Hong Kong women aged ≥20 years (mean age, 47 years) across the entire adult age range from 1995-2000 to 2005-2010. Their finding was partly consistent with the long-term reduction in hip fracture incidence in Hong Kong14). In sum, these previous studies showed that long-term changes in adult BMD are associated with changes in hip fracture occurrence. In our study, women in their 40’s and 50’s showed a decreasing BMD trend between 1995 and 2008. It will be informative to observe the changing trend of osteoporotic fracture, including hip fracture, in the next few decades (from 2021) and determine whether the decreasing BMD trend reflects the changes in fracture trend.


 Although age-adjusted BMDs of subjects in their 40’s and 50’s decreased during our study period, they did not significantly decrease when further adjusted for BMI. This suggests that the decrease in BMD was due in part to the decrease in BMI. Although the distal forearm, which we used to measure BMD, is not a weight-bearing site, forearm BMD has been reported to correlate well with BMI and body weight15,16).


 The secular decrease in BMI is not limited to the present population, but rather is a phenomenon observed throughout Japan. According to the National Health and Nutrition Survey in Japan, the BMI of middle-aged women apparently decreased during our study period17). The long-term decrease in BMI was associated with a combination of decreased energy intake and worsened exercise habits, as well as breakfast skipping17). Important factors associated with low BMI in women include a desire for thinness and dieting behavior18), which are prevalent not only among young women but also among middle-aged and older women19). Moreover, dieting behavior itself has been suggested to have an unfavorable effect on bone strength, including BMD19). The National Health and Nutrition Survey also reported a long-term decrease in calcium intake in middle-aged women, which may be involved in the decrease in BMD we observed17). Thus, controlling dietary factors is a good strategy for bone health maintenance.


 We did not observe a significant long-term decrease in BMD of subjects in their 60’s, although their BMIs decreased significantly. While the reason for this inconsistency is unclear, we speculate that menopausal status and healthy lifestyles may have played a role. Women in their 60’s are mostly post-menopausal and experience estrogen insufficiency. However, the extent of decrease in estrogen in post-menopausal women varies, which may have impacted their long-term BMD changes.


 Notably, there were some differences between the present female study population and the general Japanese female population with respect to BMI. Mean BMIs reported by the National Health and Nutrition Survey, Japan, 2004 (corresponding to the midpoint of the present study period) were 21.0 (SD 3.0, N=121), 22.6 (SD 3.6, N=127), 23.0 (SD 3.2, N=167), and 23.4 kg/m2 (SD 3.5, N=170) for women in their 30’s, 40’s, 50’s, and 60’s, respectively20). In comparison, BMIs in the present study for women in their 40’s (22.7 kg/m2 and 60’s (22.9 kg/m2) were slightly, but significantly, lower than the national average. These differences may have resulted from the present study population being a health-check population (i.e., those with potentially healthier lifestyles21)). Thus, caution should be exercised when interpreting the results of the present study.


 This study has some limitations. First, the decreasing trend in BMD may have been due to selection bias because the number of participants decreased over time during the study period. It is also possible that more women who were worried about their low BMD may have participated in the health check-up examinations later in the study period. Nonetheless, even if there was selection bias, it might not be associated with decreased BMD because the decline in number of subjects after 2008 did not bring about a corresponding decrease in BMD, but rather an increase in BMD. Second, we did not assess secular changes in some age groups given the limited sample size. In particular, changes in BMD of subjects in their 30’s tended to decrease, but not significantly. The 20’s and 30’s are important ages in terms of bone acquisition and maintenance, and thus should be investigated further. Fourth, we could not assess factors other than BMI, such as lifestyles and anti-osteoporotic medications. Nevertheless, their confounding effects may be limited, as evidenced by Japanese community studies22,23) reporting that lifestyle factors are much less influential on adult BMD than BMI (or body weight). With regard to anti-osteoporotic medications that affect BMD, such as bisphosphonates, we previously reported in a community study of BMD22) that 11 of 461 (2.4%) women aged between 60 and 75 years used such medications, whereas none of the women in their 50’s (213 women) used them. Therefore, our results may be biased in terms of the use of anti-osteoporotic medications in women aged over 60 years. Fifth, we conducted several trend tests, which may have resulted in Type I error (i.e., false positives). Finally, we measured cortical BMD, but not spongy BMD. Therefore, while our results apply to osteoporosis of long bones, they may not apply to vertebral bones.


 Our study has several implications. First, BMD is an important predictor of osteoporotic fracture, and a good indicator that reflects lifestyle factors. However, long-term trends of BMD have rarely been reported worldwide, and no reports on this topic from Japan have been published. Second, we observed a long-term decrease in BMD in middle-aged women during the period spanning 1995-2013, which could serve as an alert for a potential increase in osteoporosis risk several decades later because hip fracture typically occurs in older adults aged ≥80 years. Finally, although we observed a long-term decrease in BMD being mediated by BMI, the present study design did not allow us to determine a causal association. Nevertheless, such an association has been suggested by previous Japanese cohort studies16,24), and the results of the present study underscore the importance of BMI as a bone mass indicator.

Conclusions

 The secular decrease in BMD in middle-aged Japanese women during the period spanning 1995-2013 was partly attributed to decreases in BMI. Measures to help maintain suitable BMI will be necessary to prevent a decrease in BMD among women.

Acknowledgements

 The authors thank the staff of Shibata Comprehensive Health Care Service Center for their assistance with data collection. None of the authors have conflicts of interest to report.

Disclosure

 The authors declare no potential conflicts of interest with respect to the research, authorship, and/or publication of this article.