1.1 Equipment
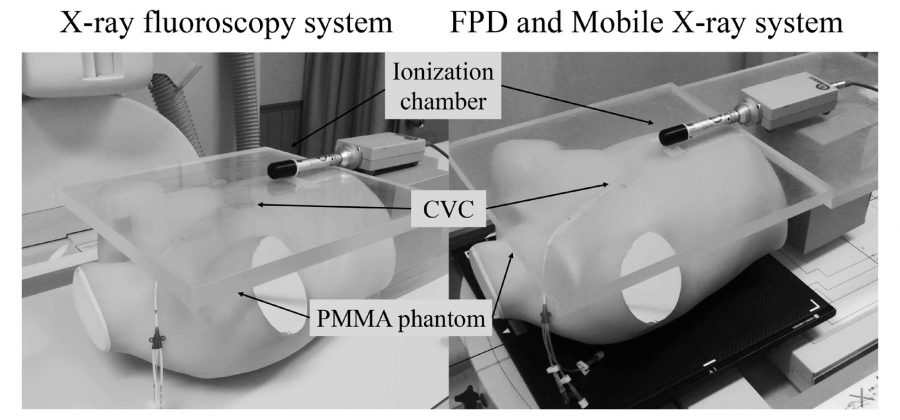
The FPD system (AeroDR1717, Konica Minolta, Tokyo, Japan) combined with a mobile X-ray system (Optima XR220amx, GE Healthcare Japan, Hino, Japan) was used. This system can display acquired images on a dedicated laptop computer approximately 14 s after X-ray exposure. The low-dose mode (L mode) of the X-ray fluoroscopy system (EXAVISTA, Hitachi Medical, Kashiwa, Japan) was used as a reference for comparison. This system can store still images with the same quality as fluoroscopic images. In this study, these fluoroscopic records were used to assess the image quality. To measure the patient surface dose, the potentiometer (Model 9015, Radcal, California, USA) was used with an ionization chamber (10 × 6 - 6, Radcal, California, USA) with an ionization volume of 6 cc. The potentiometer and ionization chamber dosimeter were calibrated by the Japan Quality Assurance Organization. The chest phantom (PBU-X-21, Kyoto Science, Kyoto, Japan) used in this study is equivalent to that of the human body, i.e., chest thickness of 18.6 cm. Furthermore, a 40 × 40-cm polymethyl methacrylate (PMMA) phantom was used to adjust the chest thickness. This is often used as a human body equivalent phantom and has a density of 1.18 g/cm314). A CVC with an outer diameter of 2.5 mm (CV Legaforce EX, Terumo, Tokyo, Japan) was selected in this study.
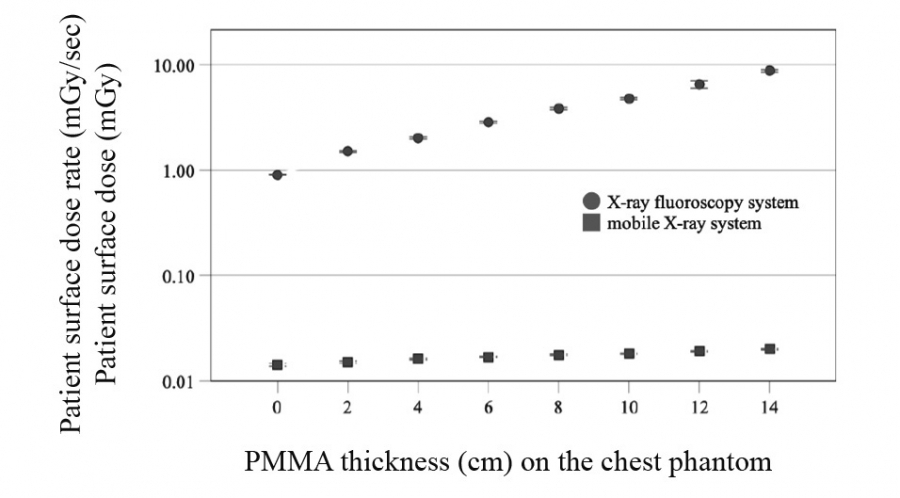
1.2 Measurement of patient surface dose in chest phantoms
The patient surface dose was measured in two combinations: FPD with the mobile X-ray system and FPD with the X-ray fluoroscopy system. The PMMA phantom was placed on the chest phantom in 2 cm increments from 2 cm to 14 cm to differentiate differences in patient body thickness. The X-ray fluoroscopy system was performed with a focal spot-to-FPD distance of 120 cm and radiation field size of 42 × 42 cm, measurements commonly used in clinical practice. The mode recommended by combined parameters of the manufacture was set to the chest (kV step, 1 kV; mAs step, 1 mAs; fluoroscopy conditions, fully automatic mode; fluoroscopy auto gamma, 1; and brightness, 1). The mobile X-ray system was used at 0.2 mAs (low-dose FPD) regardless of PMMA phantom thickness. A 0.2 mAs is the minimum value of the system. The ion chamber was placed at the midline of the chest phantom at 10 cm from the bottom. The chest phantom was irradiated using an X-ray fluoroscopy system, and the patient surface dose rate (mGy/s) was measured by varying PMMA phantom thickness. Then, the patient surface dose (mGy) was measured using the mobile X-ray system (Fig. 1).
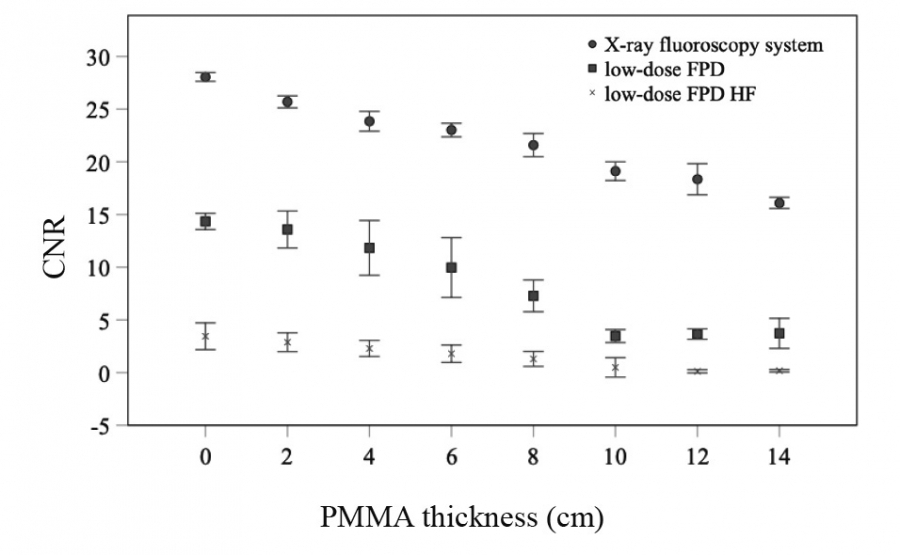
1.3 Evaluation of catheter contrast-to-noise ratio (CNR)
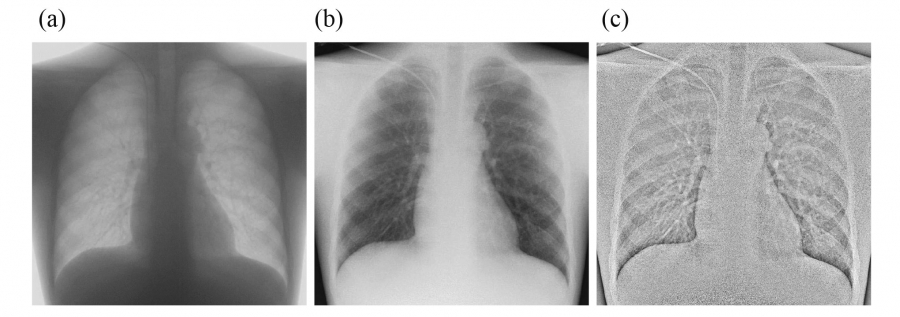
The CNR of a catheter tip was measured by combining the FPD and mobile X-ray system to evaluate the image quality and compared with that of the X-ray fluoroscopy system. The image was obtained using the geometric arrangement described in Methods 1.2. Three images of fluoroscopic recordings using the X-ray fluoroscopy system were saved 10 s after starting the fluoroscopy procedure. Three images with the FPD and mobile X-ray system were obtained for each PMMA phantom thickness. Normal images with low-dose (low-dose FPD) and high-frequency images with low-dose were generated to enhance the visibility of the catheter tip and gauze15) (low-dose HF FPD). The CVC (outer diameter 2.5 mm) was placed into the anterior chest of the chest phantom (Fig. 1) and fixed to the position shown in Figure 1; therefore, the optimal insertion position was from the superior vena cava to the upper right atrium16). An air gap of approximately 7 mm was generally provided between the PMMA phantom and CVC to prevent CVC compression through the PMMA phantom. A rectangular region of interest (ROI) of 15 × 1.5 mm was used to measure the pixel value of the CVC (SICVC); the ROI was manually set at the tip of the CVC. For the background pixel value, SIB.G. was measured with a 50 × 50 mm ROI near the CVC (Fig. 2). The obtained mean pixel values for each ROI were used to calculate CNR using the following equation:

where SICVC is the mean pixel value at the CVC tip, SIB.G. is the mean pixel value in the background, and SDB.G. is the standard deviation of the pixel value in the background.
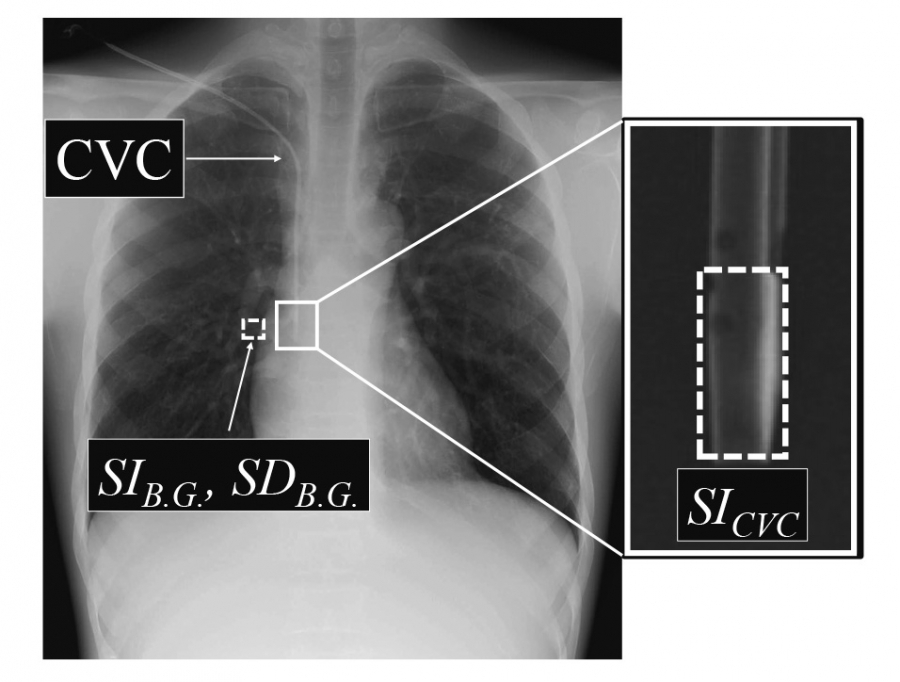
wFig. 2. ROI settings for evaluating CNR of a catheter.
Two ROIs were set on the CVC and B.G. for measuring the mean average signal intensities for CVC (SICVC) and background (SIB.G.), and standard deviation for background (SDB.G.) on the images, respectively.
CNR, contrast-noise ratio;CVC, central venous catheter;PMMA, polymethyl methacrylate;
ROI, region of interest;B.G., background.
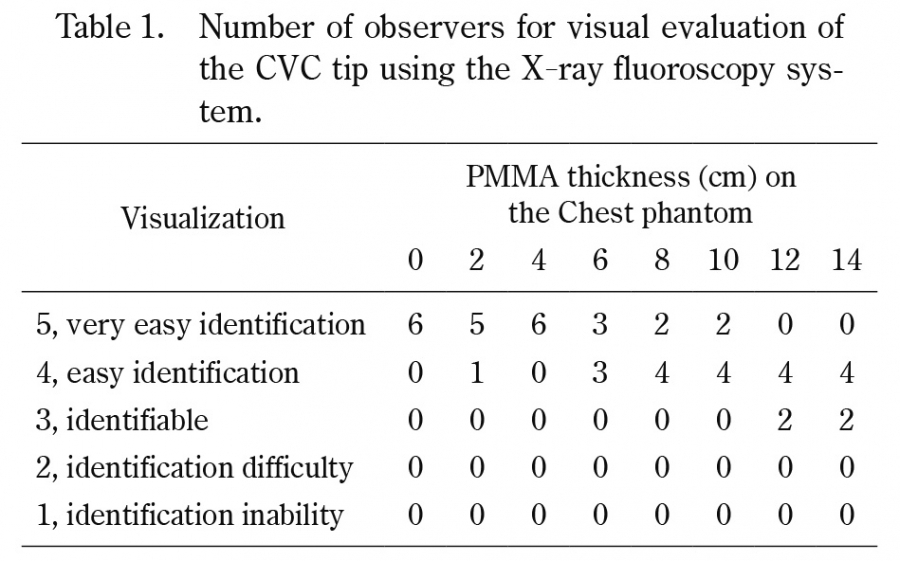
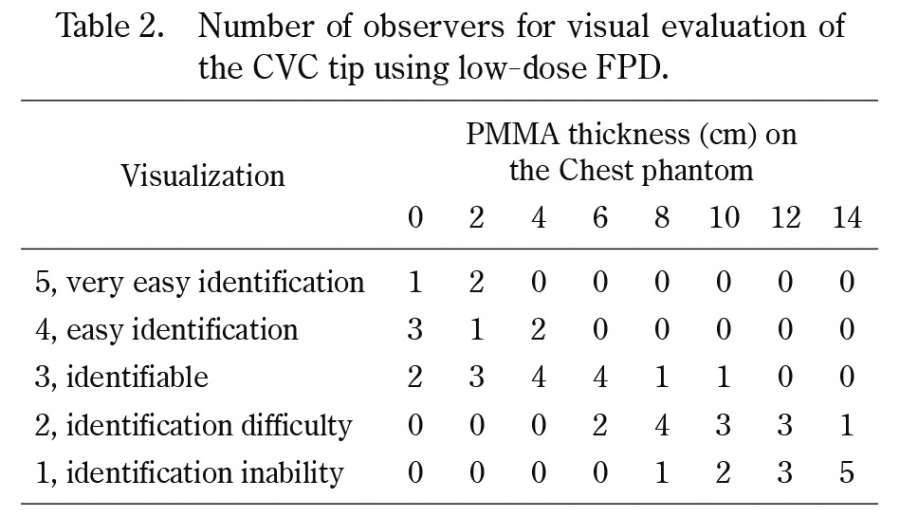
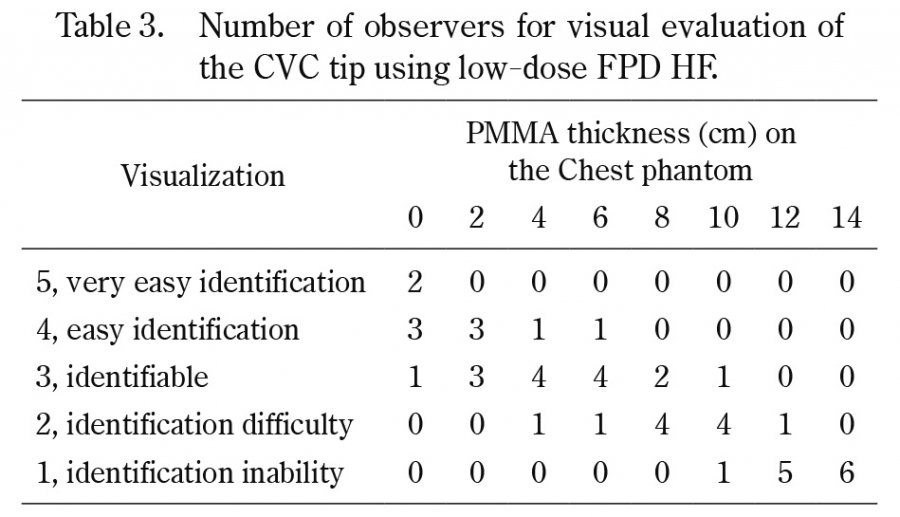
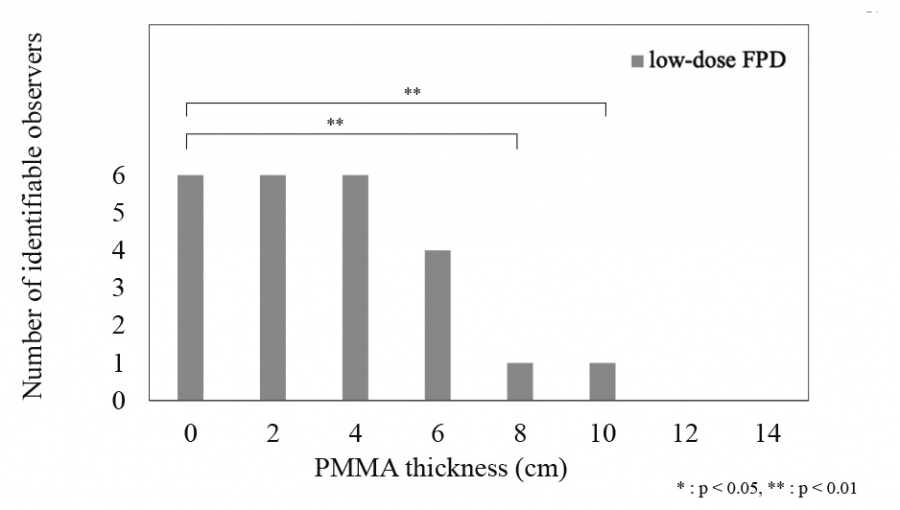
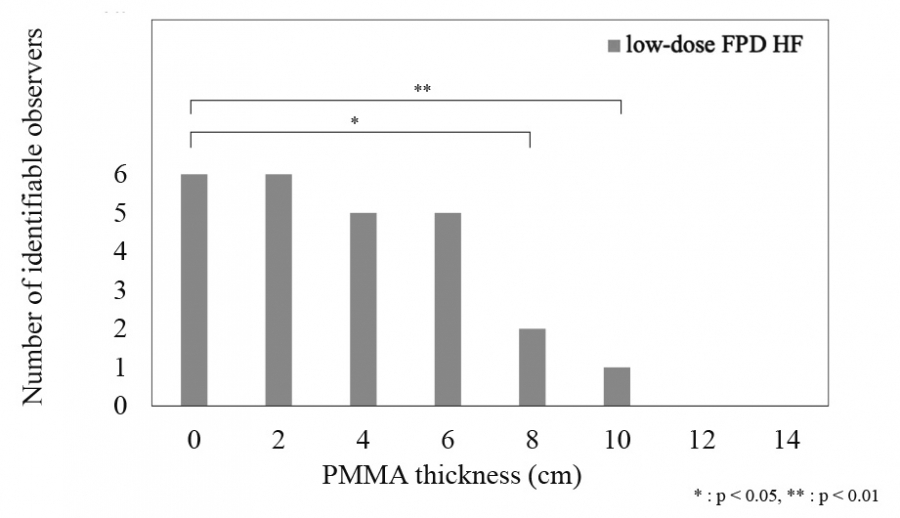
1.4 Visual evaluation of the CVC tip image
To compare the visual evaluation of the CVC tip, images were obtained for each PMMA phantom thickness in the geometric configuration in Method 1.3. The three types of images were fluoroscopic images, low-dose FPD, and low-dose HF FPD. The images were randomly reordered and transferred to a laptop computer (TOUGHBOOK CF-C2, Panasonic). Five radiologists and an emergency physician examined these images with a DICOM viewer to evaluate the CVC tip visibility. Zooming and grayscale processing were allowed freely during the observation. The visual evaluation was performed using a 5-point Likert scale as follows: 5, very easy identification, all catheters were visualized and the location of the tip was clearly assessed, providing very useful information for CVC insertion; 4, easy identification, catheters were visualized and the location of the tip was assessed, providing sufficient useful information; 3, identifiable, some catheters were difficult to visualize, but the tip could be evaluated; 2, identification difficulty, insufficient information was obtained because some catheters were visualized, but the position of the CVC tip could not be assessed and was indistinct; and 1, identification inability; no information could be obtained because no CVC tip was visualized. All observers were informed of the study objectives and provided their written consent before the study.
1.5 Statistical analyses
The results of the visual evaluation of the low-dose FPD and low-dose HF FPD were divided into two groups: those in which identification of the CVC tip was possible (score of 3 or higher) and those in which the CVC tip could not be identified (score of 1 or 2). The group with identification of the CVC tip was tested using Dunnett’s test with the PMMA phantom at 0 cm as the reference for each system. Differences were statistically significant at P < 0.05. All statistical processing was performed using the IBM SPSS Statistics version 28 (IBM, Armonk, NY, USA).