 QR code
福島県立医科大学敷地内の外気放射線量リアルタイム計測値
Radiation levels in the open air at Fukushima Medical University
Niveaux de Radiation à l'air libre à Fukushima Medical University
平成23年3月から掲載していました放射線量の計測値の表示を停止します。
==========================================================================================================
本機器が計測していた大学中庭の除染がほぼ完了し、計測される
空間放射線量も0.13μシーベルト/時前後に低下しました。
今後は、本学1号館(旧管理棟)前に原子力規制委員会が設置し
た放射線モニタリングポストの計測値をご覧ください。
放射線モニタリング情報: http://radioactivity.nsr.go.jp/map/ja
※測定地点を福島‐福島:県北‐福島市‐福島県立医科大学1号館(旧管理棟)
とし、表示してください。
※携帯版のアドレスは、http://radioactivity.nsr.go.jp/html/07C/07201/19.html
です。
==========================================================================================================
※30秒ごとに更新しています。Internet Explorerで自動的に画面が更新しない場合は、「ツール」-「インターネットオプション」-「全般」-「閲覧の履歴」-「設定」で、「ページを表示するごとに確認する」(IE6)、「Webサイトを表示するたびに確認する(IE7以降)を選択してください。
福島県立医科大学では、大学敷地内での外気の放射線量を測定し、リアルタイムで情報を提供しています。
放射線量は地面から1.6mの高さに設置されたGeiger-Mueller管で測定し、μSv/hr (マイクロシーベルト/時)に換算して表示してあります。東日本大震災以前の平均値はおよそ0.15μSv/hr でした。
Fukushima Medical University offers real-time information on radiation levels in the open air at the university.
A Geiger-Mueller tube is used for detection of radiation and displays radiation levels as μSv/hr (microsieverts per hour). An average before the earthquake on 3/11/2011 was 0.15μSv/hr.
Fukushima Medical University fournit des informations en temps réel sur les taux de radiation à l'air libre sur le site universitaire.
Un tube Geiger-Müller détecte et affiche les taux de radiation en μSv/hr (microsieverts par heure). Avant le séisme survenu le 3/11/2011, la valeur moyenne de radiation à l'air libre était de 0.15μSv/hr.

画像をクリックして拡大
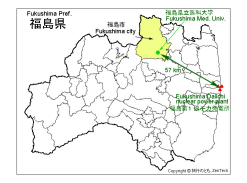
福島県立医科大学は福島第一原子力発電所から北西方向に約57km離れています。
Fukushima Medical University is located in Fukushima city, and is 57 km (35 miles) away from northwest of the Fukushima Daiichi nuclear power plant.
Fukushima Medical University est située dans la ville de Fukushima, à environ 57 km au nord-ouest de la centrale nucléaire Daiichi.
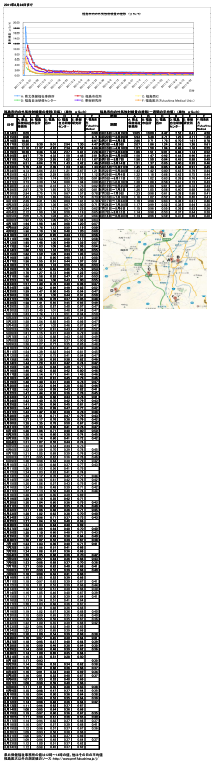
計測値の日毎の平均値の推移
The daily mean values of radiation levels
画像をクリックして拡大
上の図は、福島県立医科大学を含む福島市内の6地点(A~F)での外気中の日毎の放射線量を示しています。福島県立医科大学では3月16日に日ごと放射線量の最大平均値を示し、以後次第に低下しています。
The panels above show daily radiation levels in the open air at six points (A~F) in Fukushima city. The daily mean values of radiation levels at Fukushima Medical University (point F) reached a maximum on March 16th and decreasing afterwards.
Le tableau ci-dessus affiche les niveaux de radiation à l'air libre mesurés quotidiennement à 6 endroits différents (A~F) dans la ville de Fukushima. Les valeurs moyennes quotidiennes des taux de radiation sur le site universitaire (point F) ont atteint leur maximum le 16 Mars et ont commencé à baisser peu de temps aprés.
外部リンク(External links)
福島県が発表している東北地方太平洋沖地震による被害状況即報
Flash news of damage incurred by Tohoku Region Pacific Coast Earthquake in 2011(Fukushima International Association)
